How to Afford NYC
A StreetEasy report found earlier this year that one in three New Yorkers finds the city unaffordable, yet relatively few perceive their own homes as unaffordable. One explanation for this anomaly may be that there’s a disconnect between the homes listed on the market and what most people actually pay — a disconnect that fuels negative perceptions of the cost of living in NYC.
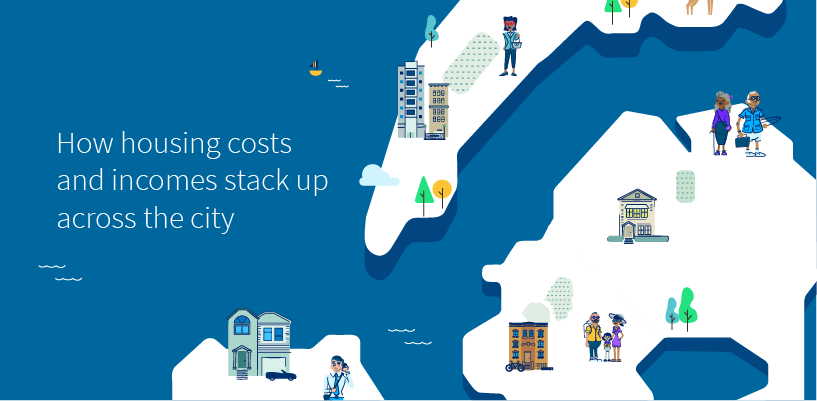
To explore these perceptions, we’ve mapped how average housing costs in NYC stack up against average income levels across the five boroughs. We began with census data covering homes that are rent-controlled, rent-stabilized and rent-subsidized. We then broke out the cost of renting, the cost of owning, and income levels for homeowners and renters by borough, to get an accurate picture of the financial outlook for New Yorkers earning the median household income.
Renters in Staten Island Have Second Lowest Incomes in the City, but Owners Have Second Highest
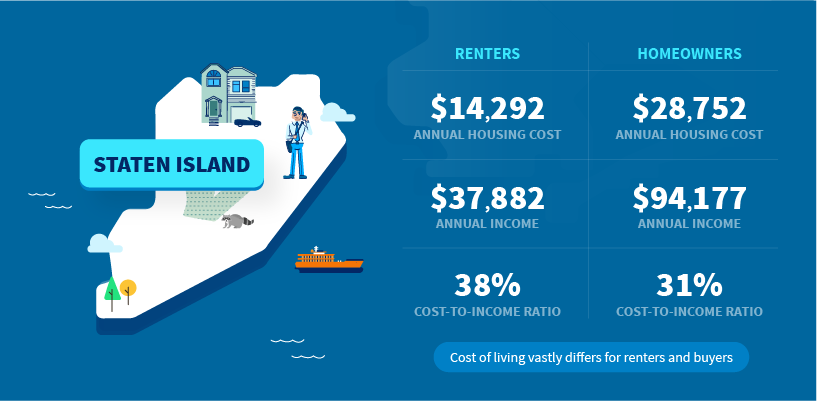
Renters in Staten Island have it tough, facing the second-lowest incomes in the city and scarce housing opportunities. Multistory apartment buildings are relatively limited here, leaving few options for renters. In fact, in 2004, new zoning was passed to prevent overcrowding and maintain the borough’s suburban vibe.
On the other hand, homeowners on Staten Island have it good, enjoying some of the city’s highest incomes and lowest costs of homeownership. The borough’s housing stock also favors homeowners over renters, with its large proportion of single-family homes.
Queens Remains Haven for Middle-Income New Yorkers
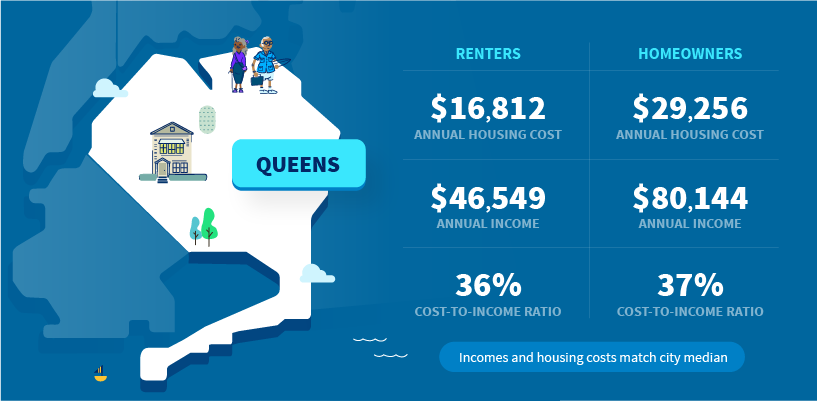
The costs of renting and owning in Queens are closest to the citywide medians of any borough, making good on Queens’ reputation as the place of choice for middle-class New Yorkers. The median renter in Queens earns slightly more than the citywide median income, but also faces slightly higher housing costs. Homeowners in Queens, however, are slightly less well off, typically earning less than the citywide median income for homeowners and also seeing slightly lower housing costs. The divergent costs of renting and owning in Queens are further corroborated by a recent StreetEasy market report that found rents falling across the borough as sales prices hit an all-time high.
In Brooklyn, Homeowners Pay More But Earn Less
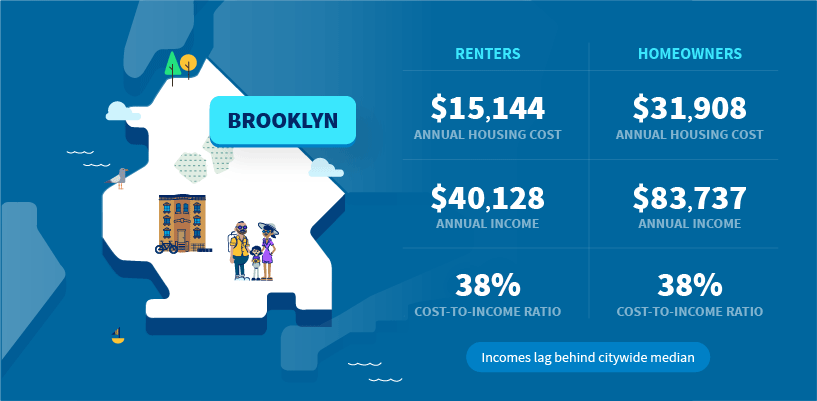
Much of the coverage of Brooklyn on StreetEasy and local media sites describes the borough as increasingly comparable, for renters and buyers, to Manhattan. And with good reason: The borough has seen rapid new development — especially luxury homes — and a resulting rise in the average cost of housing in certain pockets. Our findings here show that the cost of homeownership in Brooklyn is the second-highest in the city, behind Manhattan.
The findings, however, also indicate that on average, Brooklyn renters and buyers earn less than the New York City median income, despite facing higher respective housing costs — a fact that is often overlooked. For homeowners, Brooklyn has the highest housing-cost-to-income burden. The income burden for renters is quite high, too, with renters in Brooklyn earning an average of $20,000 less than those in Manhattan. Compared to Manhattanites, homeowners in Brooklyn earn an average of nearly $60,000 less per year.
Manhattan Renters Earn Far Less Than Owners
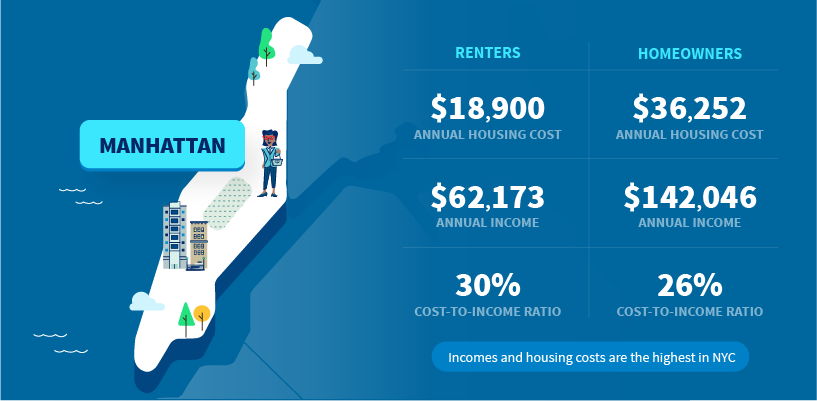
Although housing costs and incomes in Manhattan are higher than any other borough, there is a substantial difference between renters and buyers. Homeowners earn almost 130 percent of what renters do, yet see housing costs that are less than double what renters pay. But despite the financial advantages owners have in Manhattan, both in income and housing costs, renters in the borough enjoy the city’s lowest rent-to-income burden, and earn 46 percent more than the citywide median.
Yet even while earning $20,000 above than the median income in NYC, renters’ incomes still pale in comparison to those earned by homeowners in the city. Manhattan renters would have to earn another $20,000 per year to match the median income for citywide homeowners.
All that said, the significance of the rent-to-income ratio varies depending on the borough, since it’s based on median income levels. In boroughs where the spread of incomes is wide, like Manhattan, the ratio is less significant, since there are relatively few people who earn the median income and many who earn at either end of the spectrum. By contrast, in boroughs were the spread of incomes is much smaller to begin with, like the Bronx, the metric has more bearing.
Bronx Residents Face High Cost Burdens
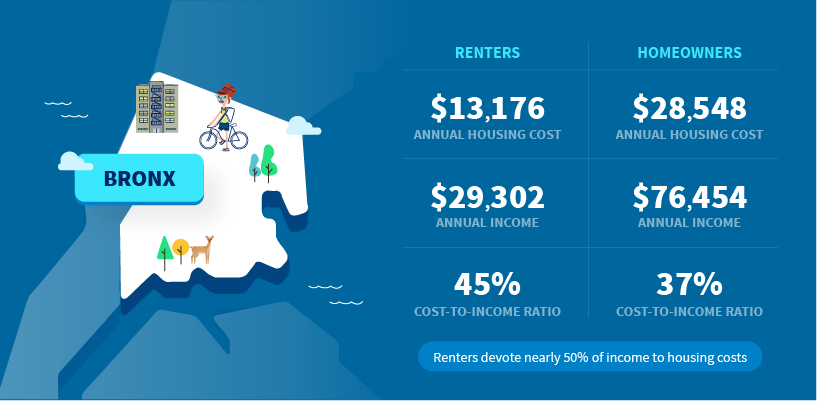
Renters and owners in the Bronx earn the least of any borough, and face the lowest absolute housing costs, but are significantly burdened by them. If Manhattanites earn more and pay relatively less, Bronx residents earn less and pay relatively more: The borough has the highest median-rent-to-income ratio in all of NYC, at 45 percent, meaning that the average earner in the median apartment pays a staggering 45 percent of their annual income in rent.
Exacerbating the difference is the fact that average renters in Manhattan make more than $33,000 more than average renters in the Bronx — an astounding difference of 112 percent — but pay rents of roughly just $500 more per month. Similarly, Manhattan homeowners earn nearly $66,000 more per year on average than those in the Bronx, despite paying a premium of only $642 in average monthly housing costs.
—
Hey, why not like StreetEasy on Facebook and follow @streeteasy on Instagram?