Few metrics are as important to comparing the value of real estate investments as the capitalization rate, or simply the “cap” rate. For property owners who rent out units, the cap rate is used to calculate the return on their investment based on the rents being generated by that property. For home buyers worried about being squeezed out of the market by investors, the cap rate is a good way to gauge investor demand.
Broadly speaking, there are three elements that influence the cap rate: rent prices, property values and property maintenance costs. While growth in rent prices would increase the cap rate, similar increases in property values and costs associated with the property could counteract the growth in expected income from the property’s rent roll. See our equation for the cap rate in the How Did We Do It? section below.
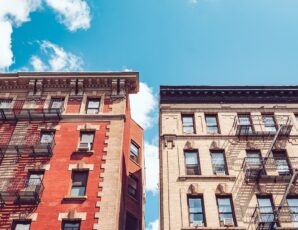
High Home Values Lower Cap Rates in Manhattan and Brooklyn
A low cap rate means there is a relatively low return on investment in the area. In a market like New York, for example, high rents are attractive to investors but high up-front costs (i.e., record-high sales prices) and maintenance costs can eat into their yields, sending the cap rate downward.
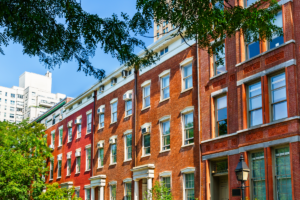
This is precisely the case in Manhattan. Since 2009, the median cap rate in Manhattan declined by nearly a point to under 3 percent last year. In other words, typical investors will earn just 3 percent of the value of their property as profit in 2015. What explains the decline? The median asking rent for units located in buildings that sold in that time period fell by roughly 4 percent, while the median sales price of those buildings increased by 11 percent to just under $1 million.
Use the chart below to see cap rates for Manhattan and Brooklyn as well as each submarkets within the two boroughs:
[tableau server=”public.tableau.com” workbook=”medCapRates” view=”capRateWindow” tabs=”no” toolbar=”no” revert=”” refresh=”yes” linktarget=”” width=”600px” height=”670px”][/tableau]
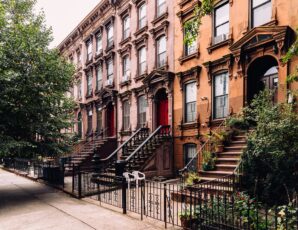
A similar decline in returns has occurred in Brooklyn. The cap rate has declined from over 5.6 percent in 2009 to 3.4 percent in 2015. The median asking rent for units located in buildings that sold between 2009 and 2015 increased by 5.3 percent to $3,450. That increase was completely offset by an increase in the recorded sale prices of those properties; recorded sale prices grew by 45 percent to $847,000 between 2009 and 2015.
How Did We Do it?
The cap rate is calculated using three sources of StreetEasy data:
- Sales listings
- Recorded sales transactions of homes that were listed
- Rental listings
The three parts of StreetEasy’s data are combined, with annualized asking rent from the rental listing making up the income. The expenses come from the maintenance and property taxes in the original for-sale listing. The recorded sale price comes from city data and is the basis of the following cap rate equation:
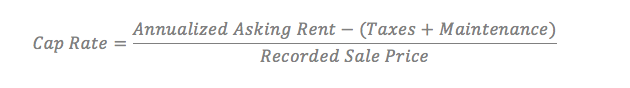
In some instances, properties were sold and then rented out years later. Assuming that they were listed for rent shortly after the sale, but not on StreetEasy, the sale prices are adjusted using the StreetEasy Price Index for the time lag. This adjustment means that all properties are included in the calculation on a comparable basis.