Record-high rents in Manhattan and Brooklyn.
Slowing price growth in the ultra-luxury sales market.
Fierce competition for a dwindling supply of homes in Upper Manhattan.
These were some of the most significant trends in the New York City real estate market in 2015. But, what is in store for 2016? What neighborhoods will likely emerge as the hottest markets for renters and buyers? We put to work our extensive market data to forecast some of the leading trends that will shape the city’s sales and rental markets in the coming year.
Slower Growth Forecasted in 2016
New York City’s sales and rental markets will ease into a slower rate of growth in 2016, according to StreetEasy forecasts[i]. While the costs of housing will remain high, New York buyers and renters can take small comfort in knowing that price growth is expected to be slower in 2016 than in years past.
The median sale price in New York City is expected to grow by 2.2 percent in 2016, 3.5 points lower than the 2015 growth rate of 5.7 percent. The cooling in price growth will occur in each of the city’s boroughs, with the greatest slowdown expected in Queens (4.6 percent lower) followed by Brooklyn (down 2.9 percentage points), Manhattan (down 2.1 percentage points), and the Bronx (down 0.7 percentage points). See the chart below for a complete breakdown of forecasted growth rates by borough.
Extremely low rental vacancy rates and a cooling in the sales market means rent price growth will likely exceed sales price growth in 2016.[ii] The city’s median rent price is forecasted to rise 3.2 percent to $3,055 – one point higher than the forecasted growth rate for sales prices. Similar to the sales market, however, growth in rent prices will be slower in 2016.
| Sales | Rents | |||||
| 2016 Median Resale Price | 2016 Sales Price Growth |
2015 Sales Price Growth |
2016 Median Rent Price | 2016 Rent Growth |
2015 Rent Growth |
|
| New York City | $622,769 | 2.2% | 5.7% | $3,055 | 3.2% | 4.2% |
| Manhattan | $990,922 | 2.6% | 4.7% | $3,192 | 2.9% | 4.1% |
| Brooklyn | $536,440 | 2.4% | 5.3% | $2,700 | 2.3% | 2.4% |
| Queens | $320,123 | 1.8% | 6.3% | $2,527 | 4.5% | 6.6% |
| Bronx | $194,624 | -3.7% | -3.1% | $1,611 | 5.2% | 9.8% |
| Staten Island | $325,942 | -1.2% | 0.1% | – | – | – |
Upper Manhattan Prices Will Climb the Fastest
Resale prices in Upper Manhattan will remain low relative to the rest of Manhattan in 2016. However, lower prices will give way to even stronger competition and rapid price appreciation in neighborhoods like Central Harlem, Hudson Heights and Inwood. According to StreetEasy’s forecasts, sales prices in the Upper Manhattan submarket are expected to rise 10.2 percent to $683,428, roughly four times the growth rate projected for New York City overall.
Upper Manhattan enters 2016 with strong growth momentum from this year. In 2015, the median sales price grew by 15.7 percent over the course of the year. Buyers seeking value will continue to bid up prices for homes above 110th Street in Manhattan. Expect this market to be among the most competitive in the city in 2016.
Slight Cooling of Manhattan’s Luxury Market Will Continue
Amid signs of a possible glut of supply and slowing demand for homes at the top end of the market, Manhattan’s luxury market is expected to cool in 2016. Prices in Manhattan’s top end of the sales market peaked in February 2015 and have seen eight consecutive months of decline through October, according to the latest data available. As of October 2015, the median sales price of the highest priced homes was 2.2 percent lower than last year and the only segment of the market in Manhattan or Brooklyn to see an annual decline.
Prices for this specific set of homes, among the most expensive in the country, saw robust growth throughout 2014 as developers rushed to meet exploding global and investor demand for premium real estate in New York. Annual growth slowed in 2015 and as supply catches up with demand, expect prices to decline in 2016.
Brooklyn Renters Will Be the Most Burdened in 2016
Renters in NYC will be even more rent burdened in 2016 than they were in 2015, largely due to rent growth far outpacing the city’s income growth[ii]. According to our analysis of forecasted rent-to-income ratios, the typical New York household is forecast to spend 65.4 percent of its total annual income to afford median rent in 2016, up from 58.7 percent in 2015. Brooklyn will have the highest burden (65.7 percent) — nearly six points higher than last year.
Renters in the Bronx will have the second highest burden with a forecast rent-to-income ratio of 52 percent, followed by Manhattan (48.8 percent) and Queens (41.4 percent). See the chart below for comparisons between 2015 and 2016 projected rent burdens by borough.
| 2016 Rent-to-Income Ratio | |
| New York City | 65.4% |
| Manhattan | 49.2% |
| Brooklyn | 65.7% |
| Queens | 51.7% |
| Bronx | 56.9% |
| Staten Island | – |
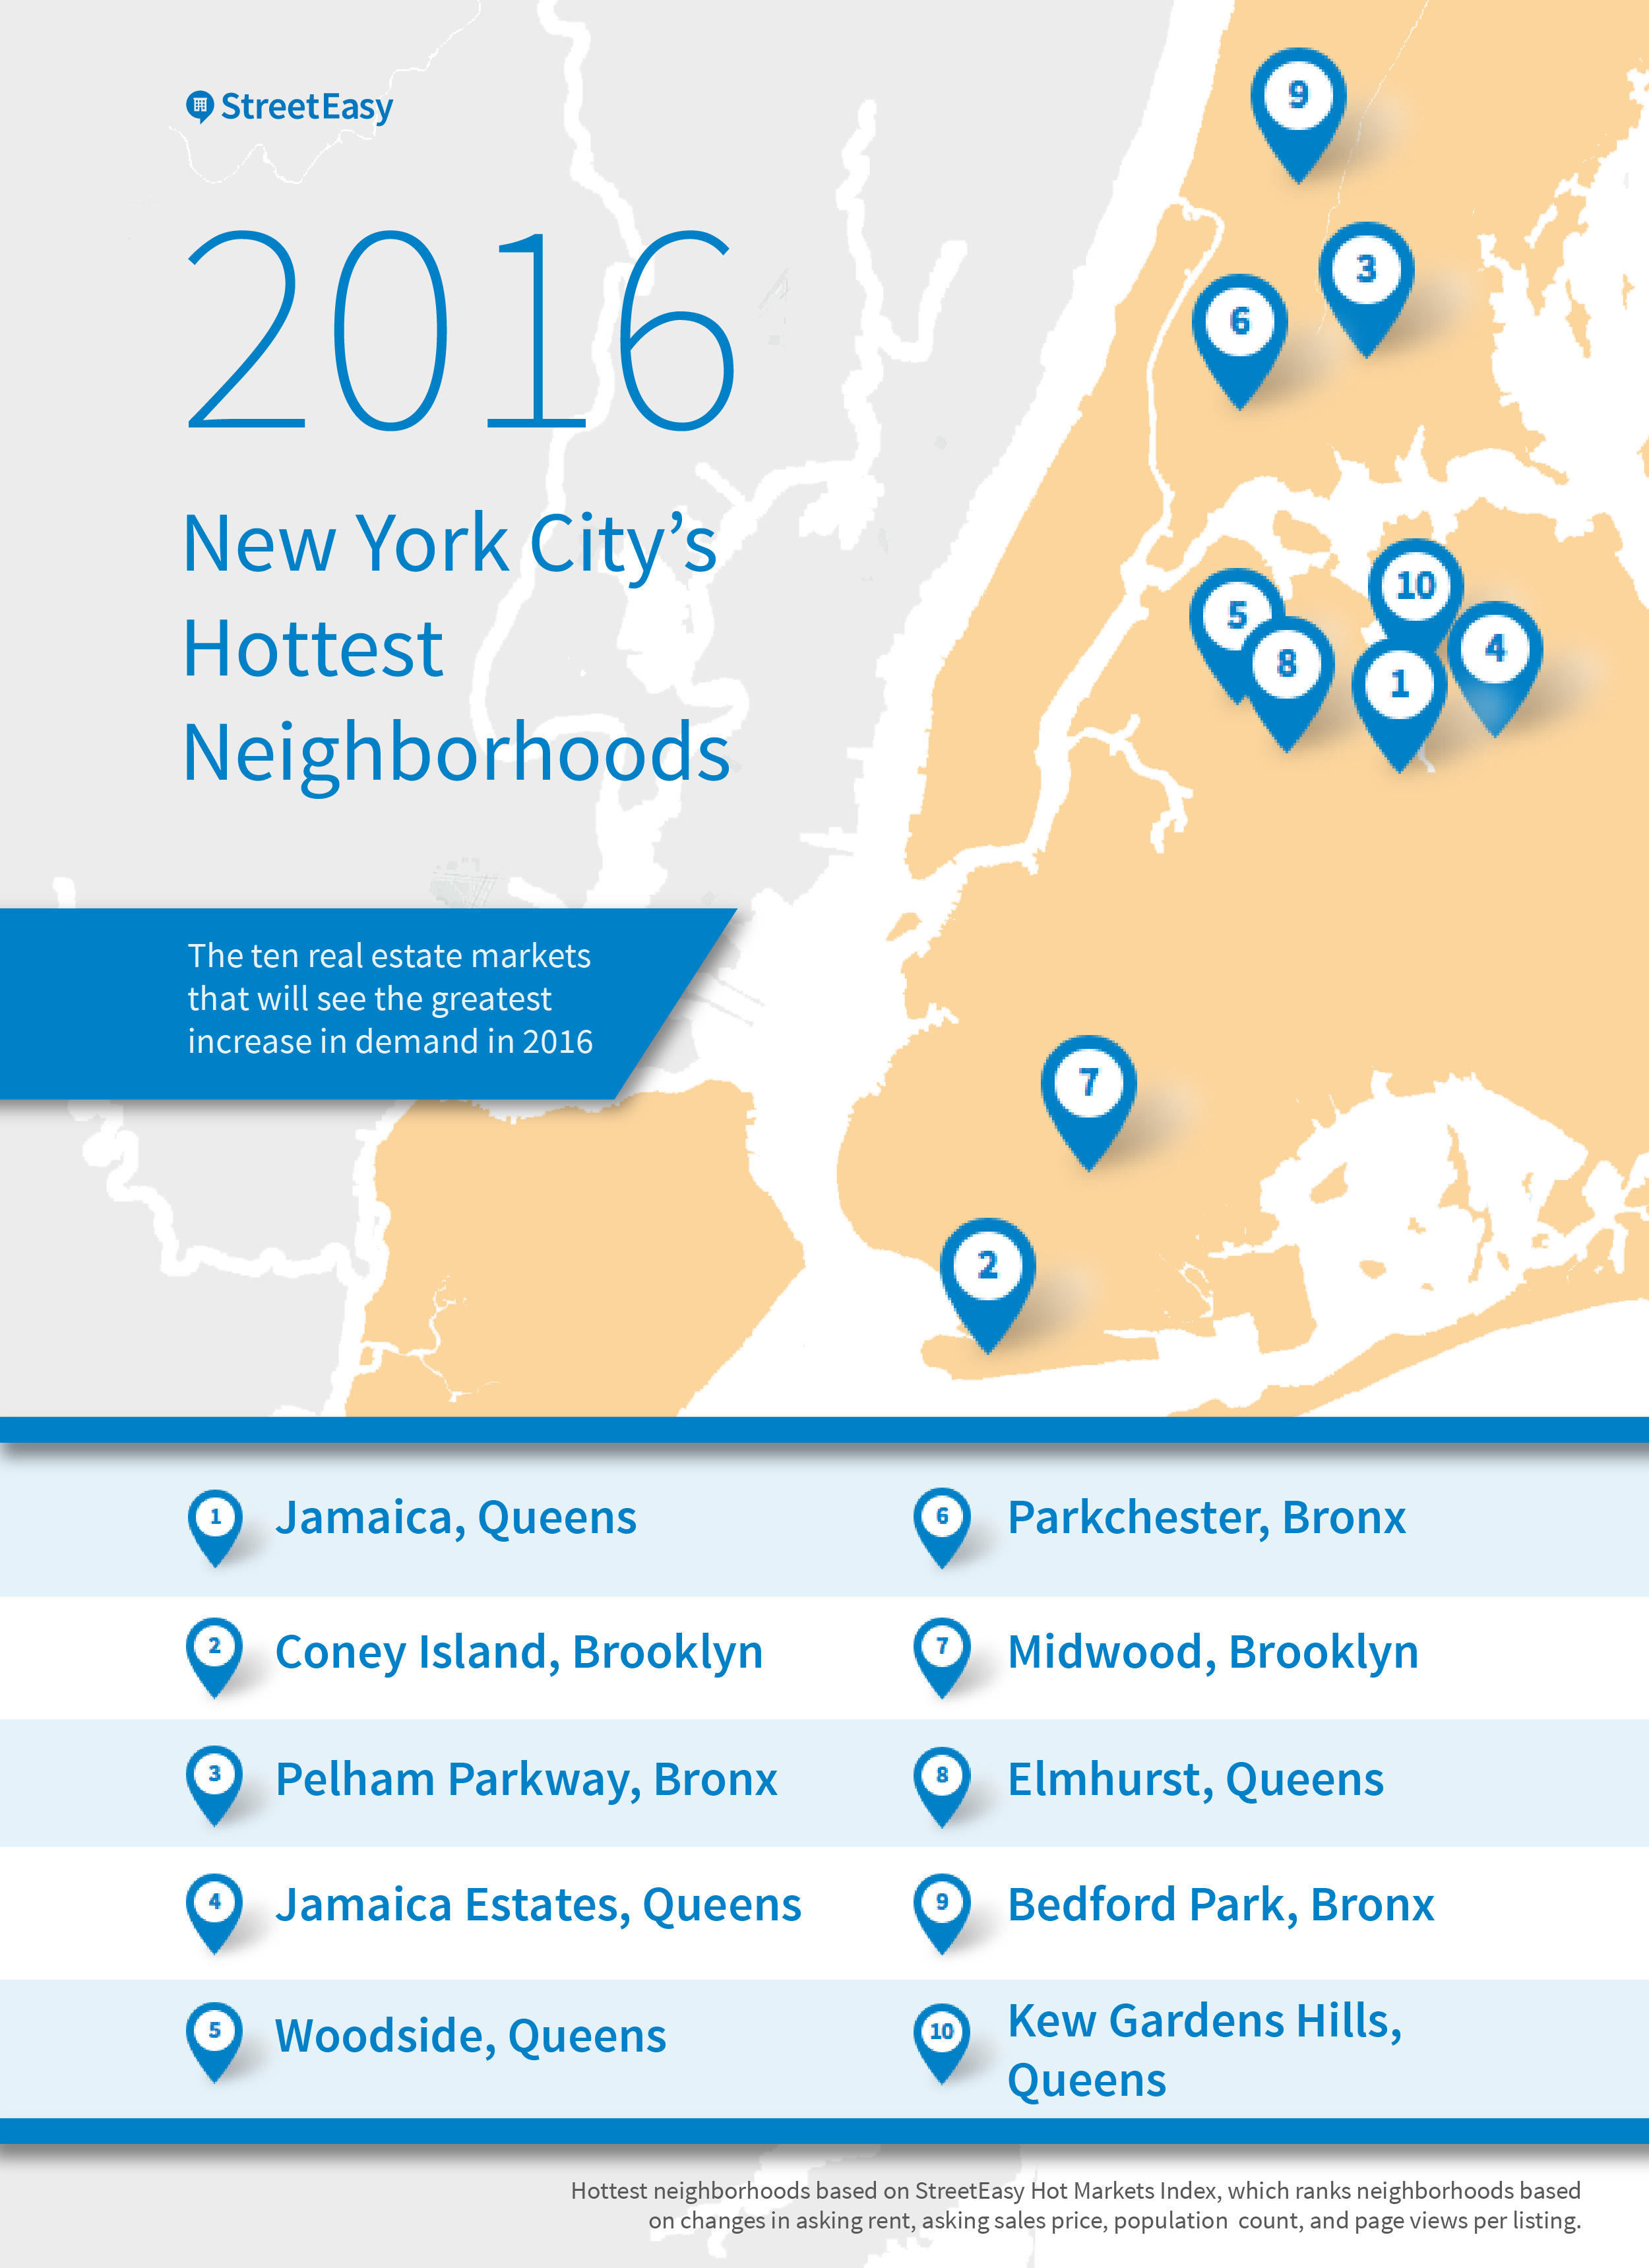
Jamaica Tops List of Hottest Neighborhoods in 2016
StreetEasy’s annual list of the city’s hottest neighborhoods is a reflection of where New York apartment shoppers are expected to turn their attention in the coming year. Queens will see a surge of new demand in 2016, according to the StreetEasy Hot Market Index, which ranks all of the city’s neighborhoods using a series of key performance indicators.[iii]
Five of the top 10 hottest neighborhoods are in Queens, with Jamaica topping the list.The rise of Jamaica is due to a number of favorable factors, including a healthy growth in population since 2011, strong growth in interest among buyers and renters, comparatively low prices and convenient access to the New York City subway and Long Island Railroad systems.What is true in Jamaica is also true in greater Queens. Strong competition in Manhattan and the Prospect Park submarket of Brooklyn may push more buyers to Queens, but there is a pull factor as well. Relatively lower prices, easy access to large job centers in Midtown Manhattan and Long Island City, and more living space for families will pull more New York buyers and renters towards Queens in 2016.
[i] Median resale price is forecast using the StreetEasy Price Forecast, a 12-month projection of resale prices derived from the StreetEasy Price Index. Full methodology for the StreetEasy Price Forecast can be found here.
[ii] Median rent is forecast using the StreetEasy Rent Forecast, a 12-month projection of rent prices derived from the StreetEasy Rent Index. Full methodology for StreetEasy’s Rent Forecast can be found here. The StreetEasy Rent Indices are calculated for Manhattan, Brooklyn, Queens, and the Bronx. Rent data for Staten Island is insufficient and is therefore not included in this analysis
[iii] Rent-to-income ratios for 2016 are calculated by forecasting median rent based on StreetEasy listings and median income among renter households in New York City. A 12-month forecast of median household income for New York City and each borough is derived from the latest available U.S. Census income data and Employment Cost Index (ECI). Income data at the census tract level is fitted to StreetEasy neighborhoods using a crosswalk methodology. Full methodology for StreetEasy’s income forecast calculation is here.
[iv] We identified the hottest neighborhoods of 2016 using the StreetEasy Hot Market Index, which takes into account four key performance indicators: Annual change in sales price, annual change in rent price, recent population growth and annual change in StreetEasy page views per listing. Population growth is derived from 2011 and 2014 Census ACS data.