
While home price fell nearly 5% in Manhattan in August, rents hit record highs. (Getty Images)
The NYC rental market continues to move in the opposite direction of the weakening sales market, with rents across the city rising at their fastest pace since 2016, according to the August 2019 StreetEasy Market Reports [i].
The StreetEasy Rent Index [ii] rose in every submarket of Brooklyn, Manhattan and Queens, with the most significant increases in some of the most expensive areas in each borough. Northwest Brooklyn [iii], for instance, experienced the fastest rate of rent growth in the city, rising 3.5% since last year to $3,115. Monthly rents in the submarket rose $100 from one year ago, a sign that demand remains high for rentals in pricey areas, as would-be buyers decide to rent instead of buy.
The StreetEasy Rent Index in Manhattan and Queens rose to record highs — up 3.0% and 3.5%, reaching $3,309 and $2,198, respectively. Mirroring the trend in Brooklyn, the most expensive areas in both boroughs saw the largest increases in rents. In Manhattan, rents in the Downtown [iv] submarket (the most expensive submarket in the city) rose 2.8% to a new high of $3,809. Rents in Northwest Queens [v], the most expensive submarket in the borough, rose 2.9%, reaching $2,318.
As rents hit new highs, sales prices dropped at brisk rates in some parts of the city and slowed in others. In Brooklyn, the StreetEasy Price Index [vi] fell by 2.4% to $691,224, the most significant drop since 2012. Queens price growth stalled to a pace not seen in more than five years, with prices remaining at $514,233, and the Manhattan market continued to weaken, with prices falling 4.9% to $1,098,104.
“As a dark cloud continues to hang over the sales market, we’re increasingly seeing those who have the money to buy finding better value in the luxury rental market while they wait and see what happens to home prices,” says StreetEasy Senior Economist Grant Long. “If rents and home prices continue to move in opposite directions, we may see more investors test their luck in the rental market in the hope of cashing in on the current demand for high-end rentals, bringing some much-needed support to the sales market.”

August 2019 Key Findings — Manhattan
- Rents rose at the fastest pace in more than three years. The StreetEasy Manhattan Rent Index rose 3.0%, the largest annual increase since February 2016, with rents reaching $3,309.
- Landlords offered fewer concessions. With rents on the rise, landlords simultaneously offered fewer concessions to prospective renters. The share of rentals advertising concessions decreased 1.3 percentage points to 13.6%.
- The median asking rent for a 1-bedroom increased significantly. Single-bedroom rentals on the market in Manhattan asked a median $233 more than last year, a 7.5% increase. Median asking rent for a 1-bedroom reached $3,350 in the borough.
- Sales prices plunged. The StreetEasy Manhattan Price Index fell 4.9% to $1,098,104, matching April 2015 price levels.
- Sales inventory growth slowed. The number of homes on the market in the borough increased 5.9%, the slowest rate since March 2018.
August 2019 Key Findings — Brooklyn
- Rents rose the most since March 2016. The StreetEasy Brooklyn Rent Index increased 3.5% to $2,695, a new record for the borough.
- Concessions were slim. Of the boroughs analyzed, Brooklyn had the lowest share of rentals advertising concessions in August at 11.7%, falling 2.4 percentage points from last year.
- Rents for 1-bedrooms in North Brooklyn increased. Rents for 1-bedroom units in North Brooklyn [vii] rose 15.9% to $3,200 — marking the first time 1-bedrooms crossed the $3,000 threshold since January 2016.
- Sales prices fell at the fastest pace since 2012. The StreetEasy Brooklyn Price Index fell sharply by 2.4% to $691,224. This marks the largest slide in prices since August 2012.
- Inventory grew at the slowest rate in 2019. There were 13.6% more homes on the market this August compared to last, but that was the smallest annual increase in inventory in 2019 thus far.
August 2019 Key Findings — Queens
- Rents rose in all submarkets. The StreetEasy Queens Rental Index increased 3.5% to $2,198. Northwest Queens [viii], the most expensive submarket, saw a 2.9% jump to $2,318, a new high for the area.
- Concessions were harder to find. As rents rose in the borough, fewer landlords offered concessions. Some 12.2% of rentals in the borough advertised concessions, a slight decrease of 0.6 percentage points from last year.
- Rents rose for 1-bedrooms in Northwest Queens. The median asking rent for a 1-bedroom in Northwest Queens rose to $2,195 – up 7.1% from last year, and higher than asking rents for similar units in Upper Manhattan.
- Sales prices remained the same. Prices in Queens stagnated at $514,233. Since 2013, prices have been steadily increasing in the borough, and August marks the second month in a row in which prices have remained level.
- More homes were on the market. There were 244 more homes for sale in the borough compared to last year, an increase of 7.6%. Like the trend seen around the rest of the city, this was the slowest pace of inventory growth seen in 2019 thus far.

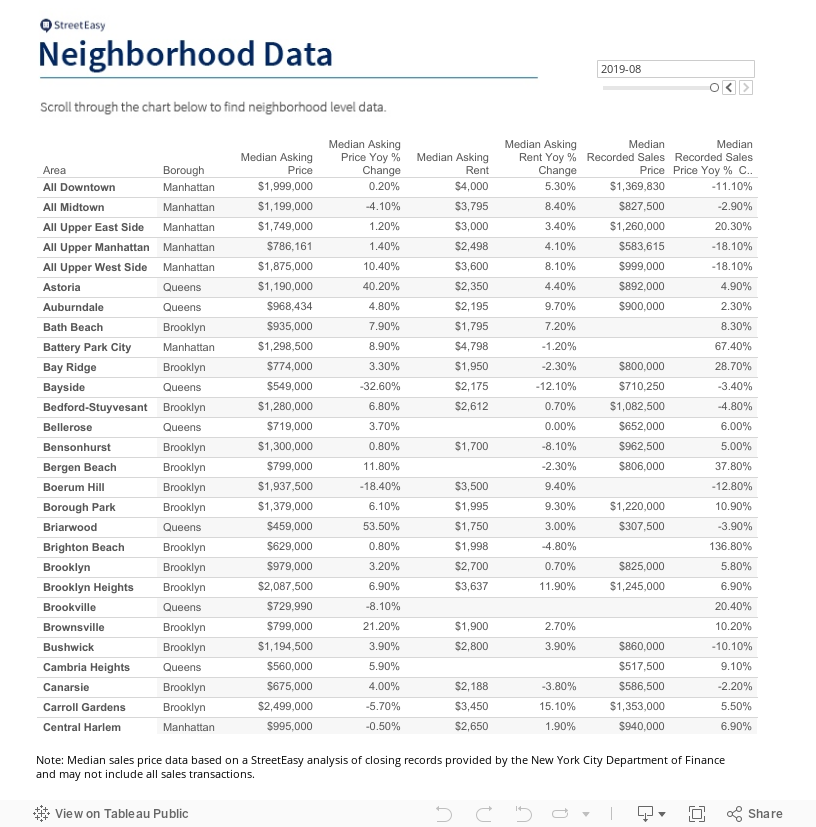
The complete StreetEasy Market Reports for Manhattan, Brooklyn and Queens, with additional neighborhood data and graphics, can be viewed here. Definitions of StreetEasy’s metrics and monthly data from each report can be explored and downloaded via the StreetEasy Data Dashboard.
[i] The StreetEasy Market Reports are a monthly overview of the Manhattan, Brooklyn and Queens sales and rental markets. Every three months, a quarterly analysis is published. The report data is aggregated from public recorded sales and listings data from real estate brokerages that provide comprehensive coverage of Manhattan, Brooklyn and Queens, with more than a decade of history for most metrics. The reports are compiled by the StreetEasy Research team. See here for more information. StreetEasy tracks data for all five boroughs within New York City, but currently only produces reports for Manhattan, Brooklyn and Queens.
[ii] The StreetEasy Rent Indices are monthly indices that track changes in rent for all housing types and are currently available from January 2007 in Manhattan, January 2010 in Brooklyn, and January 2012 in Queens. Each index uses a repeat-sales method similar that used to calculate the StreetEasy Price Indices. The repeat method evaluates rental price growth based on homes in a given geography that have listed for rent more than once. More details on methodology here.
[iii] The Northwest Brooklyn submarket includes Downtown Brooklyn, Fort Greene, Brooklyn Heights, Boerum Hill, Dumbo, Red Hook, Gowanus, Carroll Gardens, Cobble Hill, Columbia St. Waterfront District and Clinton Hill.
[iv] The Downtown submarket includes Civic Center, Financial District, Tribeca, Stuyvesant Town, SoHo, Little Italy, Lower East Side, Chinatown, Battery Park City, Gramercy Park, Chelsea, Greenwich Village, East Village, West Village, Flatiron and Nolita.
[v] The Northwest Queens submarket includes Astoria, Long Island City, Sunnyside and Ditmars-Steinway.
[vi] The StreetEasy Price Indices track changes in resale prices of condo, co-op, and townhouse units. Each index uses a repeat-sales method of comparing the sales prices of the same properties since January 1995 in Manhattan and January 2007 in Brooklyn and Queens. Given this methodology, each index accurately captures the change in home prices by controlling for the varying composition of homes sold in a given month. Levels of the StreetEasy Price Indices reflect average values of homes on the market. Data on the sale of homes is sourced from the New York City Department of Finance. Full methodology here.
[vii] The North Brooklyn submarket includes Williamsburg, East Williamsburg and Greenpoint.
—
Seeking your next place in New York? Whether you’re looking to rent or to buy, search NYC apartments on StreetEasy.