
Heightened competition during peak moving season has given the rental market a boost in July, as a rush of new residents arrive in the city and current residents move into new apartments. The share of units discounted fell citywide, reaching its lowest point in Manhattan and Brooklyn since 2011, according to the July 2018 StreetEasy Market Reports[i].
Rental discounts decreased the most in Manhattan, where only one in 10 units offered a discount during the month of July, down from nearly one in five apartments during the same time last year — a drop of 9.1 percentage points. Brooklyn and Queens saw similar declines, with the share of discounts down by 6.9 and 5.7 percentage points since last year, respectively.
As discounts fell across the city, StreetEasy also recorded rents climbing to all-time highs in Manhattan, Brooklyn and Queens. According to the StreetEasy Rent Index [ii], Manhattan rents rose to $3,225, an increase of 1.6 percent over last year, marking the fastest year-over-year rise in rents the borough has experienced in 18 months. Despite this accelerating rate of growth, it is still much slower than the monthly rate of growth that occurred between 2013 and 2016, when StreetEasy recorded 3 to 5 percent increases.
“While it’s typical to see rents peak in the summer months, the dramatic lack of discounts in July made it clear that the surge of new grads and new employees entering the city’s workforce gave landlords the upper hand this summer,” says StreetEasy Senior Economist Grant Long. “Renters are generally in a weaker negotiating position than last summer, particularly in highly sought-after neighborhoods around the city. Those able to afford the high price of entry to newer, amenity-rich buildings may have more luck; buildings in areas dense with new development remain among the most likely to offer incentives to lure new tenants.”

July 2018 Key Findings — Manhattan
- Rents rose in all Manhattan submarkets. The StreetEasy Manhattan Rent Index reached an all-time high of $3,225, an increase of 1.6 percent over last year. Upper Manhattan [iii], the least expensive submarket, experienced the largest jump, with rents rising 2.8 percent to $2,372.
- Manhattan rental discounts dropped the most among the boroughs. The share of Manhattan rentals offering discounts fell to 9.8 percent, a 9.1 percentage point drop from last year. Discounts fell in all five Manhattan submarkets, with the share in Downtown Manhattan [iv] dropping from 10.4 percent to 9.7 percent of rentals.
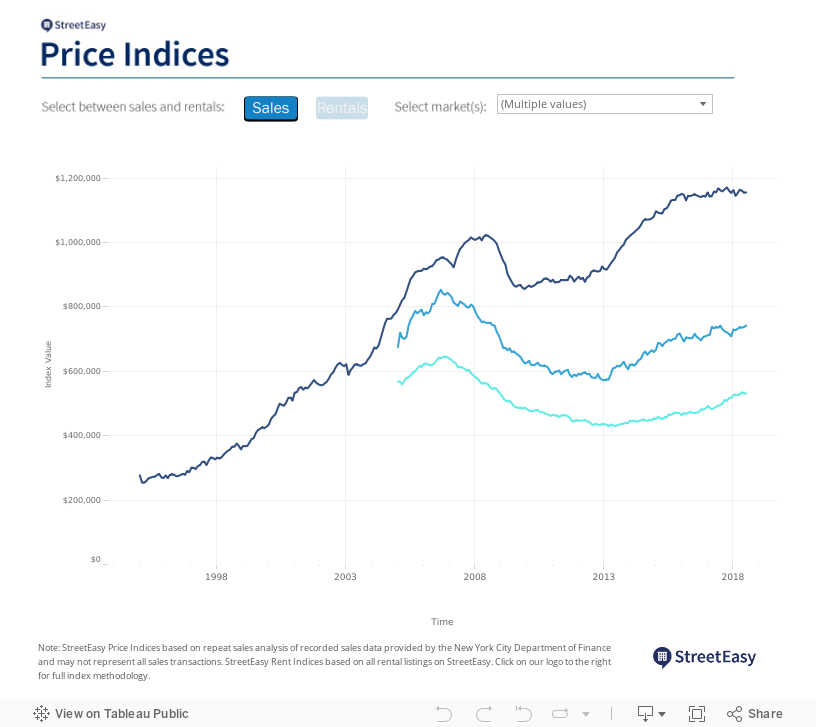
- Upper West Side sales prices dipped to 2016 levels [v]. The StreetEasy Price Index [vi] fell 5.2 percent in the Upper West Side to $1,101,567 — its lowest level since 2016. Boroughwide, prices were stagnant since last year at $1,155,467.
- Manhattan homes sold a week faster. The median days on market fell to 76 days in the borough, with homes selling 8 days faster than last year. Downtown homes sold more than three weeks faster than last year — down to a median of 74 days spent on the market.
- Sales inventory continued to rise. Sales inventory rose 14.3 percent year-over-year. Inventory in Upper Manhattan increased the most: up 24.5 percent since last year.
- Despite rising inventory, price cuts dipped. The share of for-sale homes offering discounts dropped to just 5.2 percent, a 5.2 percentage point decrease since last year.
July 2018 Key Findings — Brooklyn
- Rents rose in all submarkets except North Brooklyn. The StreetEasy Brooklyn Rent Index hit an all-time high of $2,599, an increase of 1.5 percent. Rents rose in all submarkets except for North Brooklyn [vii] where rents stagnated at $3,073, potentially caused by cooling interest among renters due to the impending L train shutdown.
- Rental discounts decreased dramatically. The share of rentals with a discount fell to 8.1 percent in Brooklyn – a 6.9 percentage point decrease from last year. North Brooklyn had the largest share of discounted rentals at 11.1 percent, though the submarket still experienced a 9.4 percentage point decrease in discounts since last year.
- Home prices were unchanged. The StreetEasy Brooklyn Price Index stagnated at $741,900. Sales prices in North Brooklyn rose 4 percent year-over-year, reaching $1,216,360.
- North Brooklyn homes sold seven weeks faster. Homes for sale in North Brooklyn spent a median of 52 days on the market, down from the 100 days they spent on the market at this time last year. Borough-wide, homes sold in 71 days, five days faster than last year.
- Price cuts fell across the borough. The share of Brooklyn homes with a price cut fell to five percent of all homes, a decline of 3.9 percentage points. Price cuts declined in every submarket, led by North Brooklyn where 3.7 percent of homes were discounted, 7.7 percentage points less than last year.
- Inventory rose across the borough, except in North Brooklyn. Sales inventory increased 17.5 percent in Brooklyn. North Brooklyn was the only submarket to experience a dip in inventory, down 4.1 percent compared to this time last year.
July 2018 Key Findings — Queens
- Rents remained flat. The StreetEasy Queens Rent Index stagnated at $2,155. Rents rose slightly in Central Queens [viii], up 1.6 percent annually to $2,093.
- Rental discounts dropped in all submarkets. Only 7.5 percent of Queens rentals experienced a discount in July, a 5.7 percent decrease from last year. In Northwest Queens [ix], discounts dropped the most: 7.2 percent of rentals had their price cut, down 8.4 percent from last year.
- Prices continued to rise. The StreetEasy Queens Price Index increased again, as it has since 2013. Prices rose 7.2 percent year-over-year to $530,917.
- Price cuts became even more rare. The share of Queens homes offering price cuts dropped to 3.8 percent, down 5.5 percentage points from last year. In Northeast Queens [x], just 3 percent of homes had their prices cut, down 6.8 percentage points since last year.
- Queens was the only borough where inventory fell. The number of Queens homes for sale dropped by 6.9 percent. Northwest Queens and Central Queens were the only areas in the borough to see an uptick, rising 13 percent and 5.5 percent, respectively.

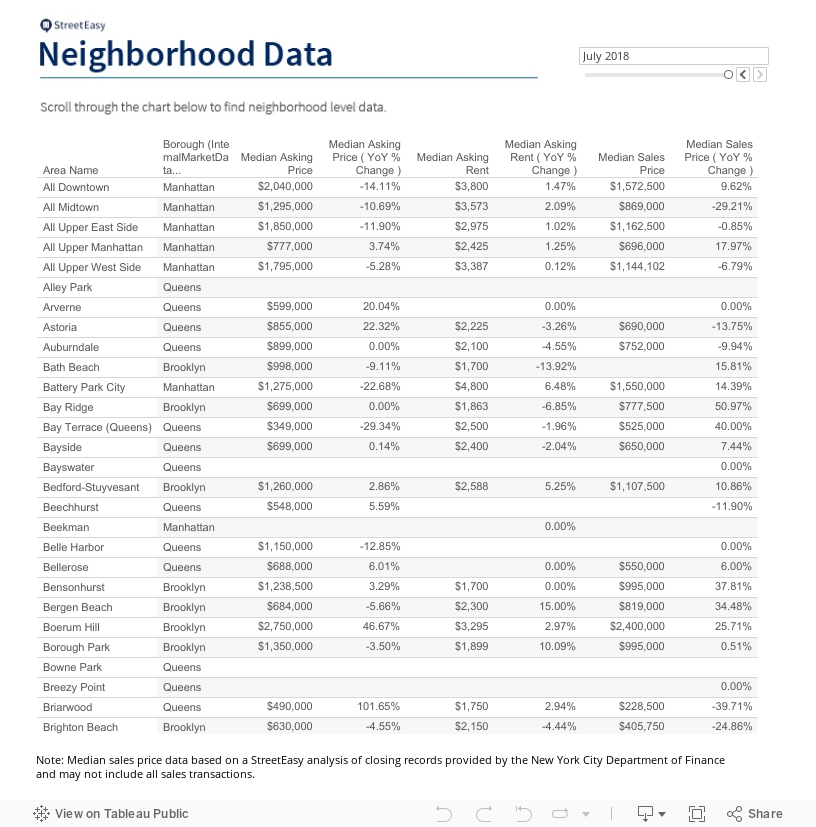
The complete StreetEasy Market Reports for Manhattan, Brooklyn and Queens, with additional neighborhood data and graphics, can be viewed here. Definitions of StreetEasy’s metrics and monthly data from each report are available here.
[i] The StreetEasy Market Reports are a monthly overview of the Manhattan, Brooklyn and Queens sales and rental markets. Every three months, a quarterly analysis is published. The report data is aggregated from public recorded sales and listings data from real estate brokerages that provide comprehensive coverage of Manhattan, Brooklyn and Queens, with more than a decade of history for most metrics. The reports are compiled by the StreetEasy Research team. See here for more information. StreetEasy tracks data for all five boroughs within New York City, but currently only produces reports for Manhattan, Brooklyn and Queens.
[ii] The StreetEasy Rent Indices are monthly indices that track changes in rent for all housing types and are currently available from January 2007 in Manhattan, January 2010 in Brooklyn and January 2012 in Queens. Each index uses a repeat-sales method similar to that used to calculate the StreetEasy Price Indices. The repeat method evaluates rental price growth based on homes in a given geography that have listed for rent more than once. More details on methodology here.
[iii] The Upper Manhattan submarket includes Central Harlem, East Harlem, Hamilton Heights, Inwood, Manhattanville, Marble Hill, Washington Heights and West Harlem.
[iv] The Downtown Manhattan submarket includes Battery Park City, Chelsea, Chinatown, Civic Center, East Village, Financial District, Flatiron, Gramercy Park, Greenwich Village, Little Italy, Lower East Side, Nolita, SoHo, Stuyvesant Town/PCV, Tribeca and the West Village.
[v] The Upper West Side submarket includes Lincoln Square, Manhattan Valley, Morningside Heights and the Upper West Side.
[vi] The StreetEasy Price Indices track changes in resale prices of condo, co-op, and townhouse units. Each index uses a repeat-sales method of comparing the sales prices of the same properties since January 1995 in Manhattan and January 2007 in Brooklyn and Queens. Given this methodology, each index accurately captures the change in home prices by controlling for the varying composition of homes sold in a given month. Levels of the StreetEasy Price Indices reflect average values of homes on the market. Data on the sale of homes is sourced from the New York City Department of Finance. Full methodology here.
[vii] The North Brooklyn submarket includes Greenpoint, East Williamsburg and Williamsburg.
[viii] The Central Queens submarket includes Corona, East Elmhurst, Elmhurst, Forest Hills, Glendale, Jackson Heights, Maspeth, Middle Village, North Corona, Rego Park, Ridgewood and Woodside.
[ix] The Northwest Queens submarket includes Astoria, Ditmars-Steinway, Long Island City and Sunnyside.
[x] The Northeast Queens submarket includes Alley Park, Auburndale, Bayside, Bellerose, Bowne Park, Briarwood, Clearview, College Point, Douglaston, Floral Park, Flushing, Fresh Meadows, Glen Oaks, Hillcrest, Kew Gardens, Kew Gardens Hills, Little Neck, New Hyde Park, Oakland Gardens, Pomonok, Queensboro Hill, Utopia and Whitestone.
—
Hey, why not like StreetEasy on Facebook and follow @streeteasy on Instagram?