
The StreetEasy Price Index for the Upper East Side rose 1.9 percent in May to $1,038,046. (Source: Busa Photography/Getty Images)
Home prices and sales inventory spiked in May, with inventory across the city reaching all-time highs, according to the May 2018 StreetEasy Market Reports [i]. While sales inventory often peaks in May amid home-shopping season, this year set new records. Inventory in Manhattan rose 16.7 percent compared to last year, the largest year-over-year increase on StreetEasy record [ii]. Brooklyn and Queens saw similar surges, with inventory up 23.4 percent and 42.8 percent, respectively.
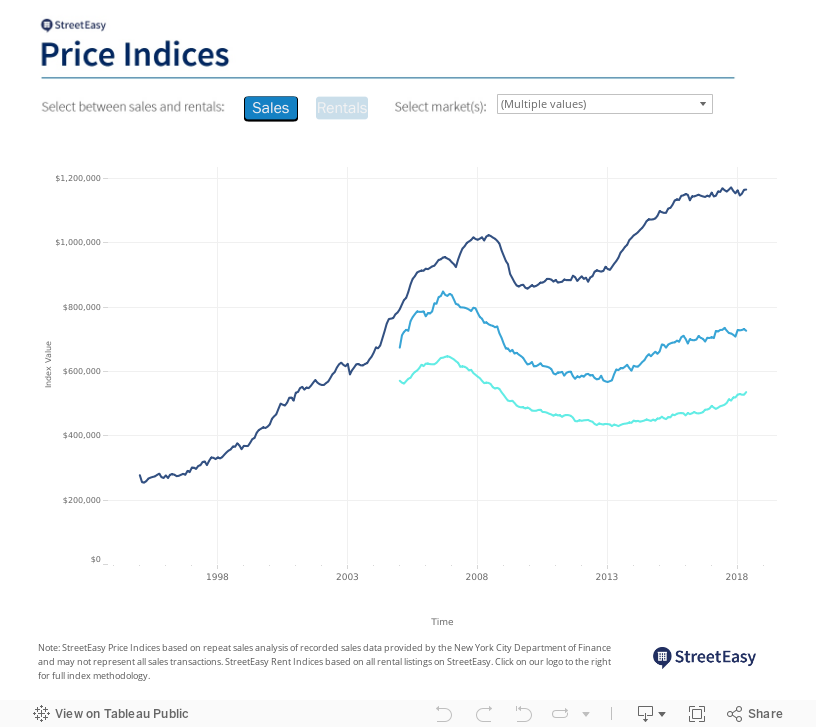
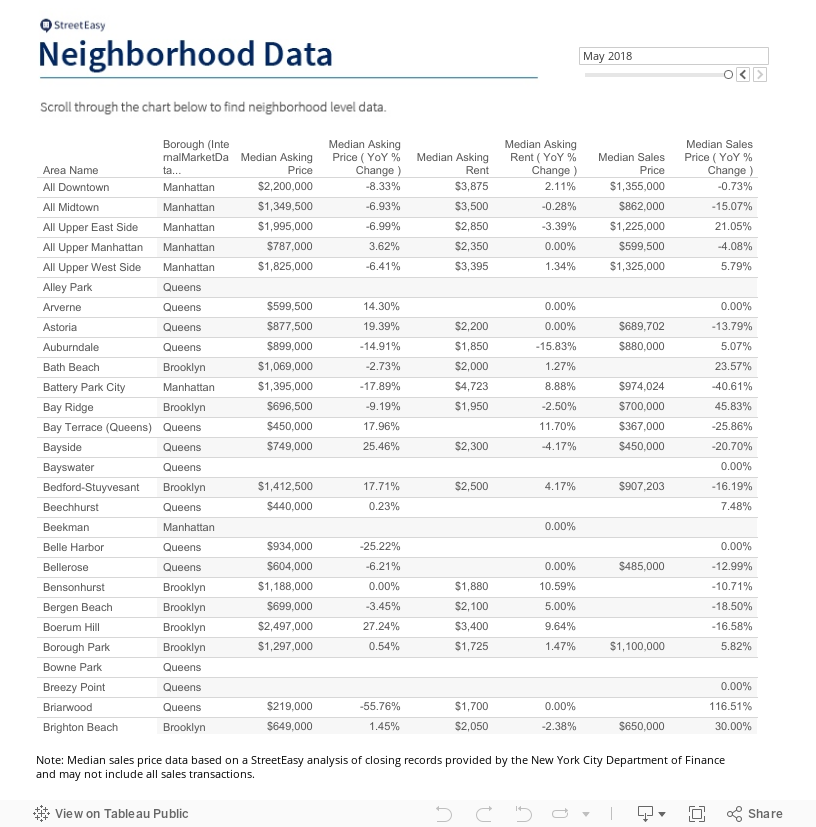
While inventory levels rose dramatically, the number of recorded sales fell for the third consecutive month. Recorded sales dropped in every submarket across Brooklyn, Manhattan and Queens, with the largest annual dips occurring in Upper East Side, Midtown and the Rockaways. Despite the additional inventory, the StreetEasy Price Index [iii] rose in all three boroughs since last year. Prices in Queens increased the most: up 9.1 percent to an all-time high of $544,587, making the median home in Queens $45,000 more expensive than a year ago.
“Sellers are betting on a wave of demand from the peak shopping season, but this summer’s market has turned out to be a crowded one,” says StreetEasy Senior Economist Grant Long. “However, prices are high and continue to rise. More affordable homes are the hardest to find, and are sure to sell quickly. But higher-end homes, particularly those joining the market from the ongoing stream of new development, will be pressured to lower prices or linger on the market. This summer is poised to offer an excellent negotiating opportunity for buyers with big budgets.”
See below for additional sales and rental market trends across Manhattan, Brooklyn and Queens.

May 2018 Key Findings — Manhattan
- Sale prices rose in all submarkets but one. The StreetEasy Manhattan Price Index increased 0.6 percent to $1,157,995. Prices rose in four of the five submarkets, led by an increase in the Upper East Side, where the median home price rose 1.9 percent to $1,038,046. Prices in Downtown Manhattan remained flat at $1,691,204.
- Inventory rose at a record pace. Sales inventory in Manhattan rose 16.7 percent year-over-year. The Upper East Side experienced the largest increase, with inventory up 20.2 percent since last year.
- One out of every six homes received a discount. Sixteen percent of homes for sale were discounted, an increase of 3.6 percentage points year-over-year.
- For-sale homes spent less time on the market. Units in the borough spent a median of 55 days on the market, a three-day dip from last year. The Upper East Side and Upper West Side were the only submarkets where homes lingered longer — up 10 days and 17 days, respectively.
- Rents rose in every Manhattan submarket. The StreetEasy Manhattan Rent Index [iv] rose 1.4 percent to $3,183. Rents in Upper Manhattan rose the most — up 2.5 percent to $2,307.
- Fewer rentals offered a discount. Sixteen percent of rentals in Manhattan were discounted in May, a decrease of 1.6 percentage points from last year.
May 2018 Key Findings — Brooklyn
- Prices reached new highs in North Brooklyn. The StreetEasy North Brooklyn Price Index increased 11.1 percent to $1,229,838, a record high for the submarket despite the looming L train shutdown. Borough-wide, prices rose by just 1.1. percent since last year, to $720,555.
- The number of homes with a price cut reached an all-time high. The share of sales with a price cut reached an all-time high of 12.4 percent, a rise of 3.3 percentage points from May 2017.
- Sales inventory continued to climb, except in North Brooklyn. Sales inventory in the borough reached a record high — up 23.4 percent over last year. Inventory rose the most in South Brooklyn, which saw a 44.7 percent increase over last year. North Brooklyn was the only submarket where inventory dropped, by 6.7 percent since last year.
- Brooklyn homes spent more time on the market. Homes stayed on the market for a median of 53 days in the borough, 6 more days than last year. North Brooklyn homes are coming off the market after an average of 43 days — 26 days faster than last year.
- Rents rose in all submarkets except North Brooklyn. The StreetEasy Brooklyn Rent Index increased 1.4 percent year-over-year to $2,562. South Brooklyn experienced the largest spike: up 2.6 percent to a median rent of $1,885. North Brooklyn was the only submarket where rents stagnated, likely because of the L train shutdown starting in April 2019. Rents in the submarket remained flat at $3,062.
May 2018 Key Findings — Queens
- Price cuts rose to an all-time high. The share of homes with a price cut reached a new high in Queens at 11.1 percent, an increase of 3.5 percentage points over last year.
- Sales inventory swelled. Queens saw the largest year-over-year increase in inventory, rising 42.8 percent. All five submarkets in the borough saw a surge in inventory.
- Queens homes are selling slightly faster than last year. The median number of days on market for Queens homes was 56, down 2 days from last year. Homes in Northeast Queens and Northwest Queens took longer to sell than last year, with an increase of 12 days and 6 days on the market, respectively.
- Rents remained flat. The StreetEasy Queens Rent Index held at $2,113. But rents in South Queens rose 6.9 percent year-over-year, to a median of $1,775.
- Queens was the only borough with an increase in the share of discounted rentals. Seventeen percent of Queens rentals offered discounts: up 2.9 percentage points over last year, and the highest share of the three boroughs analyzed.

[i] The StreetEasy Market Reports are a monthly overview of the Manhattan, Brooklyn and Queens sales and rental markets. Every three months, a quarterly analysis is published. The report data is aggregated from public recorded sales and listings data from real estate brokerages that provide comprehensive coverage of Manhattan, Brooklyn and Queens, with more than a decade of history for most metrics. The reports are compiled by the StreetEasy Research team. For more information, see our Market Reports page. StreetEasy tracks data for all five boroughs within New York City, but currently only produces reports for Manhattan, Brooklyn and Queens.
[ii] Sales inventory is the number of sales listings available on StreetEasy at any point during the month
[iii] The StreetEasy Price Indices track changes in resale prices of condo, co-op, and townhouse units. Each index uses a repeat-sales method of comparing the sales prices of the same properties since January 1995 in Manhattan and January 2007 in Brooklyn and Queens. Given this methodology, each index accurately captures the change in home prices by controlling for the varying composition of homes sold in a given month. Levels of the StreetEasy Price Indices reflect average values of homes on the market. Data on the sale of homes is sourced from the New York City Department of Finance. Full methodology here.
[iv] The StreetEasy Rent Indices utilize a similar methodology to the StreetEasy Price Indices and include only valid and verified listings from StreetEasy. By employing a repeat-rentals approach, the indices emphasize the changes in rent on individual properties and not between different sets of properties. Full methodology here.
—
Hey, why not like StreetEasy on Facebook and follow @streeteasy on Instagram?