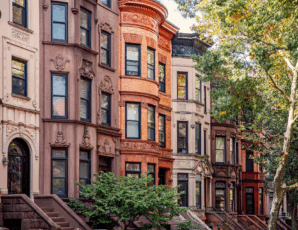
StreetEasy’s April 2020 Market Reports found new home inventory in NYC falling to historic levels. (Getty Images)
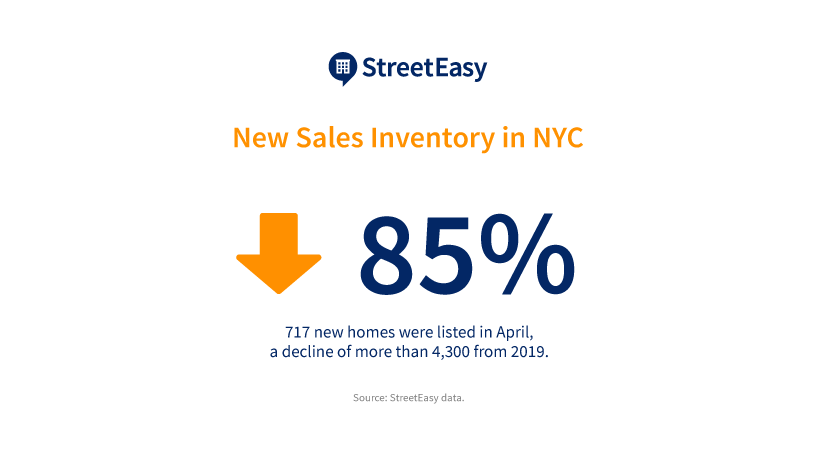
April is typically the most popular month for sellers to list their homes on the New York City market, with 5,095 added in the month last year. This year, however, with NYC an epicenter of the global coronavirus pandemic, only 717 new homes came on the market — an 85% decline from 2019, according to StreetEasy’s April 2020 Market Reports [i].
As the pandemic hit New York City, many would-be home sellers avoided the market altogether, likely opting to wait for buyer demand to return. The drop of more than 4,300 homes from 2019’s new inventory level also translated to a sharp drop in the share of price cuts being offered by sellers. In Manhattan, only 2.1% of homes for sale had a price cut in April — a drop of 12.2 percentage points from last year, and a record low for the borough.
However, the 2.1% of sellers that were making price cuts in April were determined to make a sale. The median price cut in Manhattan was a record high 5.9% off the asking price, or a median of $100,241. The highest median price cut previously observed in Manhattan was 5.4% in January 2016.
Driven sellers were also taking steps to make their homes stand out in this uncertain time. In April, 132% more listings included a walkthrough video or a 3D Home® tour compared to March, showing that sellers are working to adapt to the stay-at-home order and public health protocols.
“Most New Yorkers who don’t absolutely need to buy or sell right now simply aren’t doing so,” says StreetEasy Economist Nancy Wu. “The massive drop in inventory shows us that the majority of would-be sellers can wait, and are opting to do so to avoid any pressure to make price cuts.”
“Even so, there are still highly motivated sellers on the market right now. Those that bought a new home just prior to the pandemic, or need to move for employment opportunities or growing families, are doing whatever they can to get their existing homes off the market — including offering larger discounts.”
See below for additional sales and rental market trends across Manhattan, Brooklyn, and Queens.
April 2020 Key Findings — Manhattan
Manhattan prices continued to drop in April, as they have been for the past three years. The StreetEasy Manhattan Price Index [ii] fell 2.7%, to $1,075,366. In Upper Manhattan [iii], the borough’s least-expensive submarket, prices rose 5.0% to $656,383 — the only increase seen across the borough.
Manhattan and Brooklyn 1-2BRs Under $2700 on StreetEasy Article continues below
The StreetEasy Manhattan Rent Index [iv], which is based on prices of repeat rental units in NYC, increased to $3,308. That’s up 2.5% from last year, and the slowest pace of growth seen in 2020 thus far. Due to the coronavirus pandemic, the rentals market was coping with major disruptions in April, and it’s possible we may see growth in rents continue to slow.
April 2020 Key Findings — Brooklyn
Prices in Brooklyn fell at the fastest pace since August 2019, with the StreetEasy Brooklyn Price Index down 1.8% to $689,989. New sales inventory in the borough hit the lowest level in seven years, with 247 homes coming onto the market. Rents continued to climb, as they did before the coronavirus pandemic. In April, the StreetEasy Brooklyn Rent Index hit a record high $2,755 — up 4.8% from last year.
April 2020 Key Findings — Queens
Boroughwide, prices in Queens stayed flat at $510,345. Prices rose 3.0% to $791,203 in Northwest Queens [v], the borough’s most expensive submarket, but at the slowest pace of 2020 thus far. New inventory fell 82.3% in the borough, with just 156 homes listed on the market in April, following the citywide trend. The StreetEasy Queens Rent Index increased to $2,209, up 3.2% from last year.
View all StreetEasy Market Reports for Manhattan, Brooklyn, and Queens, with additional neighborhood data and graphics. Definitions of StreetEasy’s metrics and monthly data from each report can be explored and downloaded via the StreetEasy Data Dashboard.
[i] The StreetEasy Market Reports are a monthly overview of the Manhattan, Brooklyn and Queens sales and rental markets. Every three months, a quarterly analysis is published. The report data is aggregated from public recorded sales and listings data from real estate brokerages that provide comprehensive coverage of Manhattan, Brooklyn and Queens, with more than a decade of history for most metrics. The reports are compiled by the StreetEasy Research team. StreetEasy tracks data for all five boroughs within New York City, but currently only produces reports for Manhattan, Brooklyn and Queens.
[ii] The StreetEasy Price Indices track changes in resale prices of condo, co-op, and townhouse units. Each index uses a repeat-sales method of comparing the sales prices of the same properties since January 1995 in Manhattan and January 2007 in Brooklyn and Queens. Given this methodology, each index accurately captures the change in home prices by controlling for the varying composition of homes sold in a given month. Levels of the StreetEasy Price Indices reflect average values of homes on the market. Data on the sale of homes is sourced from the New York City Department of Finance. Full methodology here.
[iii] The Upper Manhattan submarket includes Hamilton Heights, Washington Heights, Inwood, West Harlem, Central Harlem, East Harlem, Manhattanville and Marble Hill.
[iv] The StreetEasy Rent Indices are monthly indices that track changes in rent for all housing types and are currently available from January 2007 in Manhattan, January 2010 in Brooklyn, and January 2012 in Queens. Each index uses a repeat-sales method similar that used to calculate the StreetEasy Price Indices. The repeat method evaluates rental price growth based on homes in a given geography that have listed for rent more than once. More details on methodology here.
[v] The Northwest Queens submarket includes Astoria, Long Island City, Sunnyside and Ditmars-Steinway.
—
Whether you’re looking to rent or to buy, find your next NYC apartment on StreetEasy.
