
May 2025 Housing Market Report
Key Takeaways:
NYC Sales Market
- NYC saw a 5.8% year-over-year increase in new contract signings in May, marking the ninth consecutive month of growth, driven by pent-up demand.
- New listings in May increased by 0.5% year-over-year as sellers remained active, likely encouraged by elevated asking prices and slightly lower mortgage rates compared to last year.
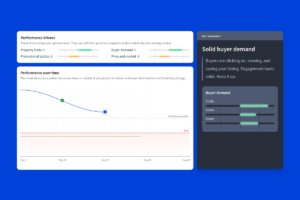
- While inventory is rising, popular homes remain competitive, underscoring the importance of strategic pricing and marketing to achieve optimal sale price relative to asking price.
NYC Rental Market
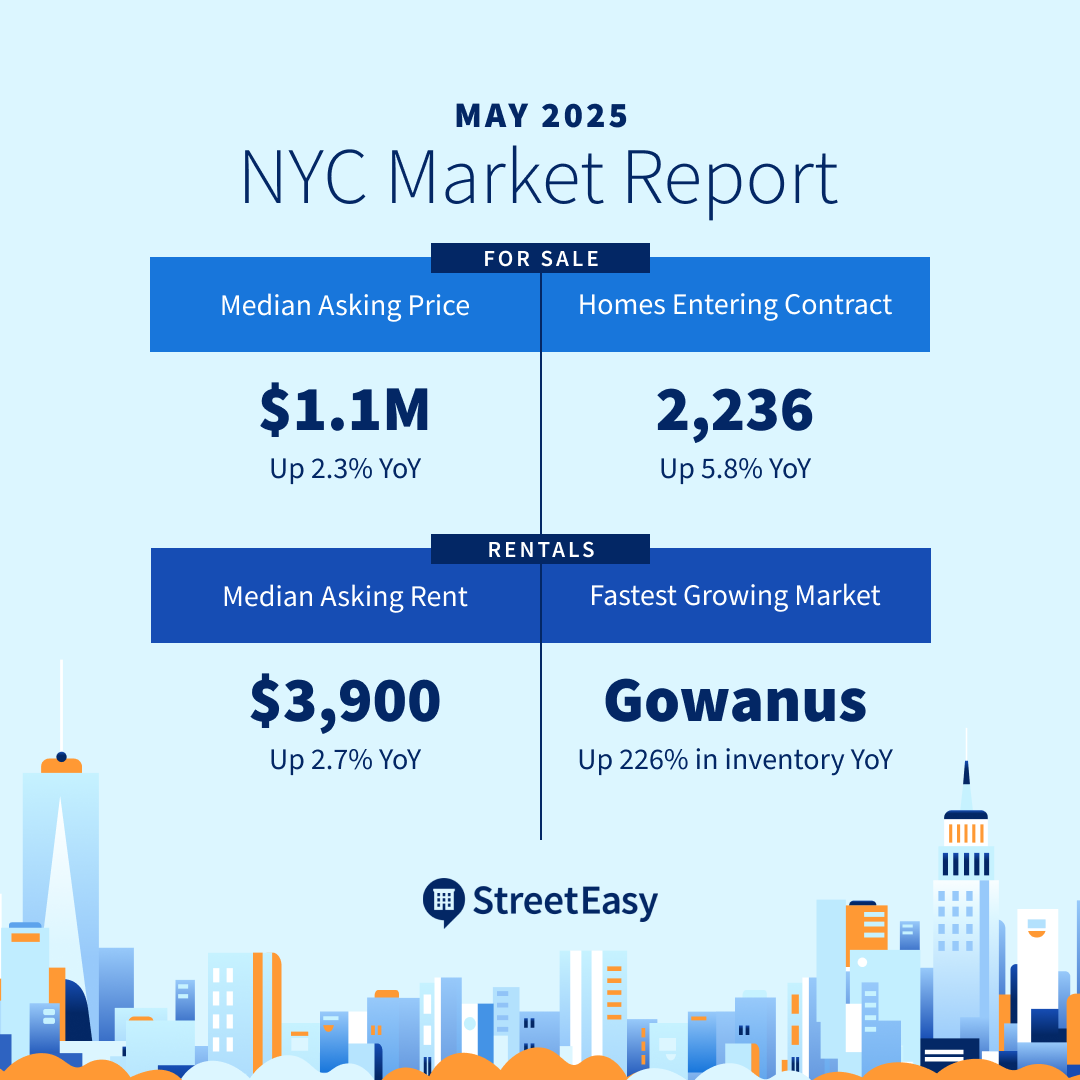
- Citywide median asking rent reached $3,900 in May, a 2.7% increase year-over-year, driven by accelerating rent growth in Manhattan.
- Rent growth continued to slow in Brooklyn and Queens, with inventory up 2.4% and 7.7% respectively. Outer boroughs will continue to fill the gap in the city’s rental inventory this year.
- Eight out of the 10 fastest-growing rental markets in the city were in Brooklyn and Queens. Many of these neighborhoods have seen a surge of new developments following a series of past rezonings.
NYC Sales Market
Strong sales activity continued in May with 2,236 homes entering contract across New York City, up 5.8% from a year ago and marking the ninth consecutive month of annual growth in contract signings. Resilient buyer activity is likely driven by pent-up demand from financially ready buyers who have been waiting for their chance to finally purchase a home.
Sellers also returned to the market after a brief pause in April. Across the city, 3,989 homes entered the market in May, up 0.5% from a year ago. While mortgage rates have been volatile, lower rates than last year are making it slightly easier for both buyers and sellers to finance their next home.
With more sellers rejoining the market, buyers can find plenty of fresh options this summer compared to last year, but NYC is far from a buyer’s market. A typical NYC home sold between January and May of this year received 97.5% of its latest asking price, about the same as last year (97.6%).
While the citywide sale-to-list price ratio has been stable, the competition for popular homes has been unwavering. Between January and May of this year, the most viewed 20% of listings on StreetEasy achieved a 100% median sale-to-list price ratio, indicating a typical seller sold at the final listed price with no price reductions. The strong performance underscores the importance of strategic pricing combined with a marketing strategy that maximizes the listing’s exposure to potential buyers.
NYC Homes Under $1.5M on StreetEasy Article continues below


NYC Rental Market
The citywide median asking rent was $3,900 in May, up 2.7% from a year ago. Rent growth is accelerating in Manhattan, the only borough with declining inventory. In May, there were 17,332 rentals in the borough, down 6.4% from last year. The median asking rent in Manhattan was $4,595 in May, 4.4% higher than a year ago. High mortgage rates are likely keeping prospective buyers in their rentals for longer, pushing down the vacancy rate in the borough.
By comparison, renters can find more options in Brooklyn and Queens. Brooklyn had 12,791 rentals in May, up 2.4% from a year ago. Rental inventory in Queens soared 7.7% from last year to 4,845 homes. Eight out of the 10 fastest-growing rental markets in the city were in Brooklyn and Queens. Many of these neighborhoods have been seeing a surge of new developments following a series of past rezonings. The top neighborhood was Gowanus, which saw rental inventory more than triple to 313 units in just one year. As new developments continue to enter the market, outer boroughs will fill the gap in the city’s rental inventory this year.
NYC Rentals Under $3,500 On StreetEasy Article continues below


Fastest-Growing Rental Markets in New York City in May 2025
| Neighborhood | Borough | Inventory (YoY Change) | Median Asking Rent | |
|---|---|---|---|---|
| 1 | Gowanus | Brooklyn | 313 (+226%) | $4,665 |
| 2 | Flushing | Queens | 204 (+50%) | $2,568 |
| 3 | Morningside Heights | Manhattan | 218 (+46%) | $4,600 |
| 4 | Fort Greene | Brooklyn | 316 (+43%) | $4,641 |
| 5 | DUMBO | Brooklyn | 235 (+40%) | $4,454 |
| 6 | Long Island City | Queens | 1155 (+22%) | $4,444 |
| 7 | Forest Hills | Queens | 268 (+20%) | $2,700 |
| 8 | Bay Ridge | Brooklyn | 290 (+19%) | $2,400 |
| 9 | Jamaica | Queens | 213 (+17%) | $2,965 |
| 10 | Mott Haven | Bronx | 521 (+16%) | $3,130 |
Increasing inventory across most of the city puts the rental market in a good position ahead of the Fairness in Apartment Rental Expenses (FARE) Act, effective June 11th. By requiring that the hiring party compensate a rental broker in New York City, we believe the new law is likely to bring immediate relief from high upfront costs for the city’s renters without substantial increases in base rent.
With new developments taking up a greater market share, the share of rentals that did not charge tenants a broker fee rose to 56% last month, ahead of the FARE Act, the highest of any May since the pandemic. This high share of no-fee rentals before the new law will likely limit its impact on the city’s overall rents. As the rental market adjusts to a new norm, the improved fee transparency will make the renting process more equitable and efficient, which will be beneficial for all sides of the market.
NYC Market Data: May 2025
Sales
 NYC |  Manhattan |  Brooklyn |  Queens | |
|---|---|---|---|---|
| Median asking price | $1,100,000 (+2.3% YoY) | $1,495,000 (±0% YoY) | $1,100,000 (+3.9% YoY) | $695,000 (+10.6% YoY) |
| Number of homes for sale | 17,940 (+11.2% YoY) | 9,581 (+9.4% YoY) | 4,402 (+13.6% YoY) | 2,996 (+14.9% YoY) |
| Homes entering contract | 2,236 (+5.8% YoY) | 1,077 (+9.5% YoY) | 652 (+2% YoY) | 395 (+7.9% YoY) |
| Median days on market | 57 (-2 YoY) | 64 (-2 YoY) | 46 (-4 YoY) | 57 (+9 YoY) |
Rentals
NYC | Manhattan | Brooklyn | Queens | |
|---|---|---|---|---|
| Median asking rent | $3,900 (+2.7% YoY) | $4,595 (+4.4% YoY) | $3,634 (+3.8% YoY) | $3,150 (+3.3% YoY) |
| Number of homes for rent | 36,145 (-1.2% YoY) | 17,332 (-6.4% YoY) | 12,791 (+2.4% YoY) | 4,845 (+7.7% YoY) |
| Share of rentals with price cuts | 12.7% (-1pp YoY) | 13.9% (-0.9pp YoY) | 12.1% (-1.5pp YoY) | 11.7% (+0.5pp YoY) |
| Share of rentals offering concessions* | 12.5% (+1.1pp YoY) | 7.9% (-2.2pp YoY) | 14.2% (+3.2pp YoY) | 19.3% (+5.3pp YoY) |
StreetEasy is an assumed name of Zillow, Inc. which has a real estate brokerage license in all 50 states and D.C. See real estate licenses. StreetEasy does not intend to interfere with any agency agreement you may have with a real estate professional or solicit your business if you are already under contract to purchase or sell property. All data for uncited sources in this presentation has been sourced from Zillow data. Copyright © 2025 by Zillow, Inc. and/or its affiliates. All rights reserved.