New York City has gotten a head start on the busy spring home shopping season. In February, the number of contracts signed reached near record-highs in all boroughs analyzed. Home prices took a dive compared to where they were last year, just before the COVID-19 pandemic hit New York City. StreetEasy’s February 2021 Market Reports demonstrate just how much of a buyers’ market NYC is right now.
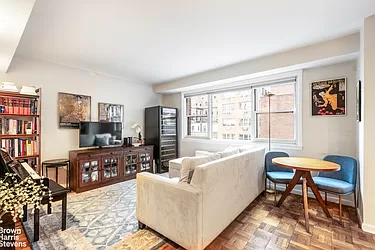
In Manhattan, 1,304 homes entered contract in February. That’s the most in a single month in eight years, and up 70.7% from last February. At the same time, the StreetEasy Manhattan Price Index fell 5.0%, and the median asking price was $1,395,000. Even though the price index continued its downward trajectory, fewer sellers made price cuts to homes sitting on the market. The share of price cuts in Manhattan dropped to 8.6% — 2.6 percentage points lower than last year.
This shows that, instead of cutting prices to attract a buyer, sellers are either pricing lower from the get-go, or accepting offers below list price during offline negotiations. Either way, in this NYC buyers’ market, sellers are facing the fact that they need to remain competitive in order to move their homes off the market.
Manhattan Homes Under $800K on StreetEasy Article continues below
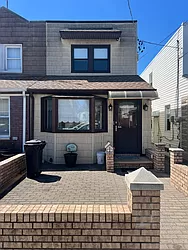
In Brooklyn, the Price Index dropped 5.5%, the largest drop on StreetEasy record. At the same time, February saw 773 pending sales, nearly matching the record high of 774 set in October 2020. The borough’s median asking price was $900,000. That’s the lowest it’s been since 2015, and one of the main reasons for such a surge in buyer activity.
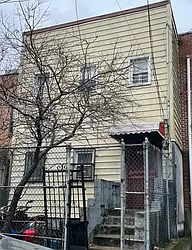
In Queens, home prices were unchanged compared to last year. But the number of homes entering contract still increased by 31.4% from last year.
“We’re now a year into the pandemic, and for many buyers, it’s been a year of window shopping and waiting for the right time to make a move on a home,” says StreetEasy Economist Nancy Wu.
“With prices coming down, an abundance of homes for sale, the vaccine rollout picking up speed, and the real chance that mortgage rates are only going to increase, NYC buyers in this market have declared that now is the time to make an offer.”
Manhattan Buyers Still Have Lots to Choose From, Even As Home Inventory Growth Slows
The number of homes for sale in Manhattan was 23.9% higher in February 2021 compared to last year. Total inventory peaked in October 2020, but it remains significantly higher than what is typically expected during the winter months. High inventory is crucial to a buyers’ market in NYC. “This is a good sign for buyers heading into the home shopping season,” says Wu. “Even though demand is returning and sales are rebounding, a glut of inventory still puts the buyer in the driver’s seat when it comes to negotiating.”
Home Sales Nearly Doubled in Williamsburg and Greenpoint
Borough-wide, the number of contracts signed in Brooklyn was just below the record highs seen in the fall. It’s a sign that demand remains strong in this NYC buyers’ market. In February, the North Brooklyn submarket, which is comprised of the Williamsburg and Greenpoint neighborhoods, had 80 homes enter contract. That’s up from 44 last February — an increase of 81.8%. Even with such strong demand, the North Brooklyn Price Index fell 2.7%. The median asking price was $1,397,000. Both neighborhoods made an appearance on StreetEasy’s recent list of 2021 Neighborhoods to Watch.
Brooklyn Homes Under $800K on StreetEasy Article continues below
Queens Home Prices Hold Strong, Except in the Most Expensive Nabes
The Queens Price Index was stagnant compared to last February, the only borough we analyzed without a significant drop. However, in Northwest Queens, the most expensive submarket — made up of Long Island City, Astoria, and Sunnyside — prices fell 1.2%. The median asking price there was $845,000, and it was also the submarket with the biggest jump in pending sales. The number of homes that entered contract in Northwest Queens just about doubled from last February, reaching 118 sales. That’s up from 61 last year, just before the pandemic hit the city.
View all StreetEasy Market Reports for Manhattan, Brooklyn, and Queens, with additional neighborhood data and graphics. Definitions of StreetEasy’s metrics and monthly data from each report can be explored and downloaded via the StreetEasy Data Dashboard.
—
Whether you’re looking to rent or to buy, find your next NYC apartment on StreetEasy.


