Key takeaways:
- Nearly 1 in 2 homes listed for sale in New York City in 2025 remain unsold, highlighting the challenge of selling.
- As their listings languish on the market, many sellers may eventually give up, but this is nothing new: nearly 2 in 5 homes that entered the market between 2022 and 2024 didn’t sell.
- Top-performing listings stood out not just by pricing competitively, but by capitalizing on strong buyer demand through a more compelling listing experience.
- For middle- and low-performing homes, boosting exposure to high-intent buyers and adjusting prices would play a larger role in improving their strength.
- StreetEasy Performance Pulse, included within enhanced Listing Insights, can help agents spot troubles early and proactively optimize their listing strategy across key drivers like property traits, buyer demand, promotional tactics, and price and market.
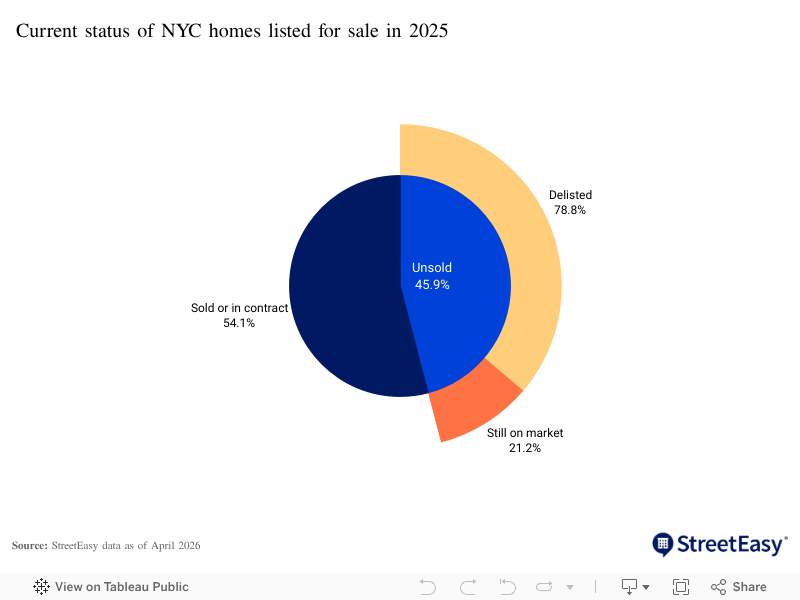
According to StreetEasy® data, nearly 1 in 2 New York City homes listed for sale in 2025 remain unsold. Among those that haven’t sold, 79% have been delisted without a sale, while 21% remain on the market.
Some of the homes still on the market may eventually sell this year. Sellers who joined the market in late 2025 can still lean into the freshness of their listings and strong buyer demand this spring, following a moderation in mortgage rates earlier this year. However, as their listings sit on the market, many sellers may eventually give up. Selling a home in the city has never been easy due to the complex market. Across NYC, nearly 2 in 5 homes that entered the market between 2022 and 2024 did not sell.
Meanwhile, some listings that entered the market in 2025 outperformed the rest by a large margin: among homes that sold, 17% sold above their most recent asking price with a median premium of 3.1%, while the remainder sold with a median discount of 3.0%. This raises a crucial question for listing agents:
What separates these standout listings from those that struggle to sell?
To answer this, we developed the StreetEasy Performance Pulse, a comprehensive indicator of a listing’s standing in today’s market. The meaning is simple: the higher the pulse, the higher the likelihood of the home selling.
Generally, a higher Pulse indicates the listing has characteristics and engagement patterns associated with a greater likelihood of selling, based on the model’s analysis of historical StreetEasy listing data.
What is the StreetEasy Performance Pulse?
The machine learning model powering Performance Pulse scores is built on StreetEasy’s extensive data from more than 200,000 listings, including property details, advertising choices, and buyer engagement. By analyzing how each data point contributes to a listing’s overall score, the model can explain what may be driving performance relative to comparable listings across four distinct categories:
- Property traits: Physical aspects of each property such as location, bedrooms, building type, and amenities.
- Buyer demand: Buyer engagement indicators such as clicks from search results, listing views, and saves.
- Promotional tactics: Listing agents’ actions that may impact listing visibility on StreetEasy such as open houses and price adjustments.
- Price and market: Market conditions that may influence performance such as mortgage rates and listing prices.

Applied to the NYC market, among nearly 38,000 homes listed for sale in 2025, the median Performance Pulse score was 45.1%, and the median for those that sold was 59.7%. The median for those still on the market is 27.5%.
High or low Performance Pulse scores do not guarantee a certain outcome. Instead, scores are designed to serve as a companion for agents to help them fine-tune their strategy in real time, based on the listing’s standing in the evolving market across the four groups of performance drivers. See Methodology section to learn more about the model.

Performance Pulse scores indicate what sets apart standout listings from stagnant ones
To understand which drivers matter the most, we calculated a Performance Pulse score for all NYC homes that entered the market in 2025 and analyzed how each data point moved the home’s score. Afterwards, we aggregated the impact of individual drivers into four performance groups and translated them to a 0 to 1 scale, with a higher number indicating a more positive role in shaping Performance Pulse scores. See Methodology section for technical details.
Compared across the strongest 10%, middle, and bottom thirds by Performance Pulse score, our findings reiterate that the most effective strategy depends on a listing’s momentum relative to the market.
What separates the best of the best?
The top 10% of homes scored by the Performance Pulse model had it all. Compared to lower-performing listings, the top 10% saw higher average impacts from all four performance driver categories: buyer demand, price and market, property traits, and promotional tactics.
That said, what differentiated the top 10% the most was buyer demand. The average impact of buyer demand signals for the top-performing listings was 0.74, 35.6% higher than the next strongest group within the top third (Performance Pulse scores between the 90th and 66th percentiles), underscoring the importance of maximizing a listing’s reach and appeal to capture buyers’ attention.
Smart pricing relative to comparable listings and market conditions is a prerequisite to high performance. The average impact of price and market signals on Performance Pulse scores was 0.65 for the top 10%, compared to 0.59 for the next strongest within the top third. The difference in impact between the two groups was 10.7%.

What differentiated middle-tier listings?
Increasing marketing efforts can have a greater impact on listings that have not yet maximized their potential. Compared to the top third, the middle third of listings (Performance Pulse scores between the 90th and 66th percentiles) saw smaller average impact from buyer demand as well as price and market signals. For this group, promotional tactics played a larger role with an average impact of 0.51, 9.1% higher than that of buyer demand and 3.8% higher than that of price and market signals.
What this middle group needs the most is visibility. Within demand metrics, search clicks moved the Performance Pulse score the most for these listings, followed by saves and views. The average impact of search clicks was 0.52, 3.1% higher than 0.51 for saves and 20.2% higher than 0.44 for views. Without enough buyers clicking on the listing during their search, home shoppers cannot take meaningful next steps like saving the listing or sending an inquiry. The StreetEasy Signature℠ tier of StreetEasy Agent Advantage℠ can expand a listing’s reach through priority ranking in relevant search results and targeted shopper emails.
The key difference between the top and middle groups was the ability to convert buyer traffic on listing pages into the next meaningful step, such as saving the listing. For the top 10%, saves were pivotal with an average impact of 0.73, 44.7% higher than the middle group. Views were the next most important, averaging 0.53, 20.7% more impactful than the middle group. While top listings saw 9.2% less average impact from search clicks than the middle group, the stronger influence of higher-intent signals such as saves and views more than offset this difference. More immersive visuals and prominent agent branding, offered in the StreetEasy Signature℠ tier within StreetEasy Agent Advantage℠, can encourage more meaningful buyer engagement.

What can be done to help bottom-tier listings?
The bottom third of listings (Performance Pulse scores below the 33rd percentile) saw a lower average impact across all four groups of key drivers than higher-performing listings. For this bottom group, buyer demand was the weakest with an average impact of 0.35, less than half of the impact on top-performing listings.
Outdated pricing was likely one of the reasons for low demand signals for the bottom group. The average impact of price and market on Performance Pulse scores for the bottom group was 0.37, well below 0.49 for the middle group. StreetEasy Agent Advantage℠ offers tools such as customizable comps reports and enhanced Listing Insights that can help agents refine their pricing strategies early.
Meanwhile, bottom-tier listings can benefit from increasing discoverability. The average impact of promotional tactics on Performance Pulse scores for the bottom group was 0.49, 39.0% higher than 0.35 for buyer demand signals and 31.1% higher than 0.37 for price and market. Scheduling additional open houses and expanding the listing’s exposure through Featured Listings may translate into an improvement in performance.
Similar to the middle group, the bottom-third listings struggled to turn buyer interest into meaningful next steps. While search clicks had a relatively strong impact of 0.53, even higher than for top listings, saves and views were underwhelming for the bottom group. The average impact from saves and views was just 0.42 and 0.40, trailing higher-performing homes and signaling weaker follow-through from buyers.

Turning insights into action
The preceding analysis indicates that standout listings outperform others not just by pricing well relative to comparable homes and market conditions, but by driving up buyer interest. That attention is then turned into meaningful engagement that can potentially lead to inquiries and ultimately a sale. The top 10% of listings by Performance Pulse scores set themselves apart through significantly higher buyer demand signals, particularly saves and views. In contrast, middle- and bottom-third listings underperformed primarily due to insufficient exposure and unrealistic pricing, and relied more heavily on promotional tactics to make up for lukewarm demand.
The Performance Pulse model can help agents adjust pricing and marketing strategies based on real-time data to build up momentum and avoid stagnation. By understanding what’s driving a listing’s performance through an intuitive dashboard within enhanced Listing Insights, agents can proactively spot potential improvements depending on the ebb and flow of the listing’s momentum. Combined with other data-driven tools offered in the StreetEasy Signature℠ tier of StreetEasy Agent Advantage℠, agents can focus their efforts where they matter most: helping their clients succeed in an evolving market with more clarity and confidence.
Methodology
The model powering the StreetEasy Performance Pulse feature leverages XGBoost, a modern machine learning technique based on gradient boosted decision trees. Gradient boosting builds a sequence of many small decision trees that address each other’s shortcomings, gradually improving overall prediction accuracy. Combined with controls that limit overfitting, this model can efficiently identify patterns and relationships in complex data and make highly accurate predictions. Our model was trained and tested on StreetEasy’s extensive data from more than 200,000 listings across New York City, including property details, market conditions, agents’ advertising choices, and buyer engagement.
To analyze the impact on Performance Pulse scores, we used this model to calculate Performance Pulse scores for each of nearly 38,000 NYC homes that entered the market in 2025 and analyzed their SHAP (SHapley Additive exPlanations) values, which break down model outputs as a sum of feature contributions. The SHAP values were calculated following the tree-path dependent approach, which limits the computation to the data distribution observed within the decision tree structure, rather than relying on simulated data sampled from the training set. This approach helps us understand how the model produces a specific output while keeping computational complexity in check.
To compare key performance driver groups (property traits, buyer demand, promotional tactics, and price and market) as displayed on StreetEasy Listing Insights, we summed the resulting SHAP values for features corresponding to each driver group for each listing. Afterwards, these net values were averaged and scaled to a 0-1 range by performance percentile groups based on Performance Pulse scores. We call this measure an “average impact,” with a higher value signifying a stronger net contribution of a performance driver category to Performance Pulse scores.
StreetEasy is an assumed name of Zillow, Inc. which has a real estate brokerage license in all 50 states and D.C. See real estate licenses. StreetEasy does not intend to interfere with any agency agreement you may have with a real estate professional or solicit your business if you are already under contract to purchase or sell property. All data for uncited sources in this presentation has been sourced from Zillow data. Copyright © 2026 by Zillow, Inc. and/or its affiliates. All rights reserved.