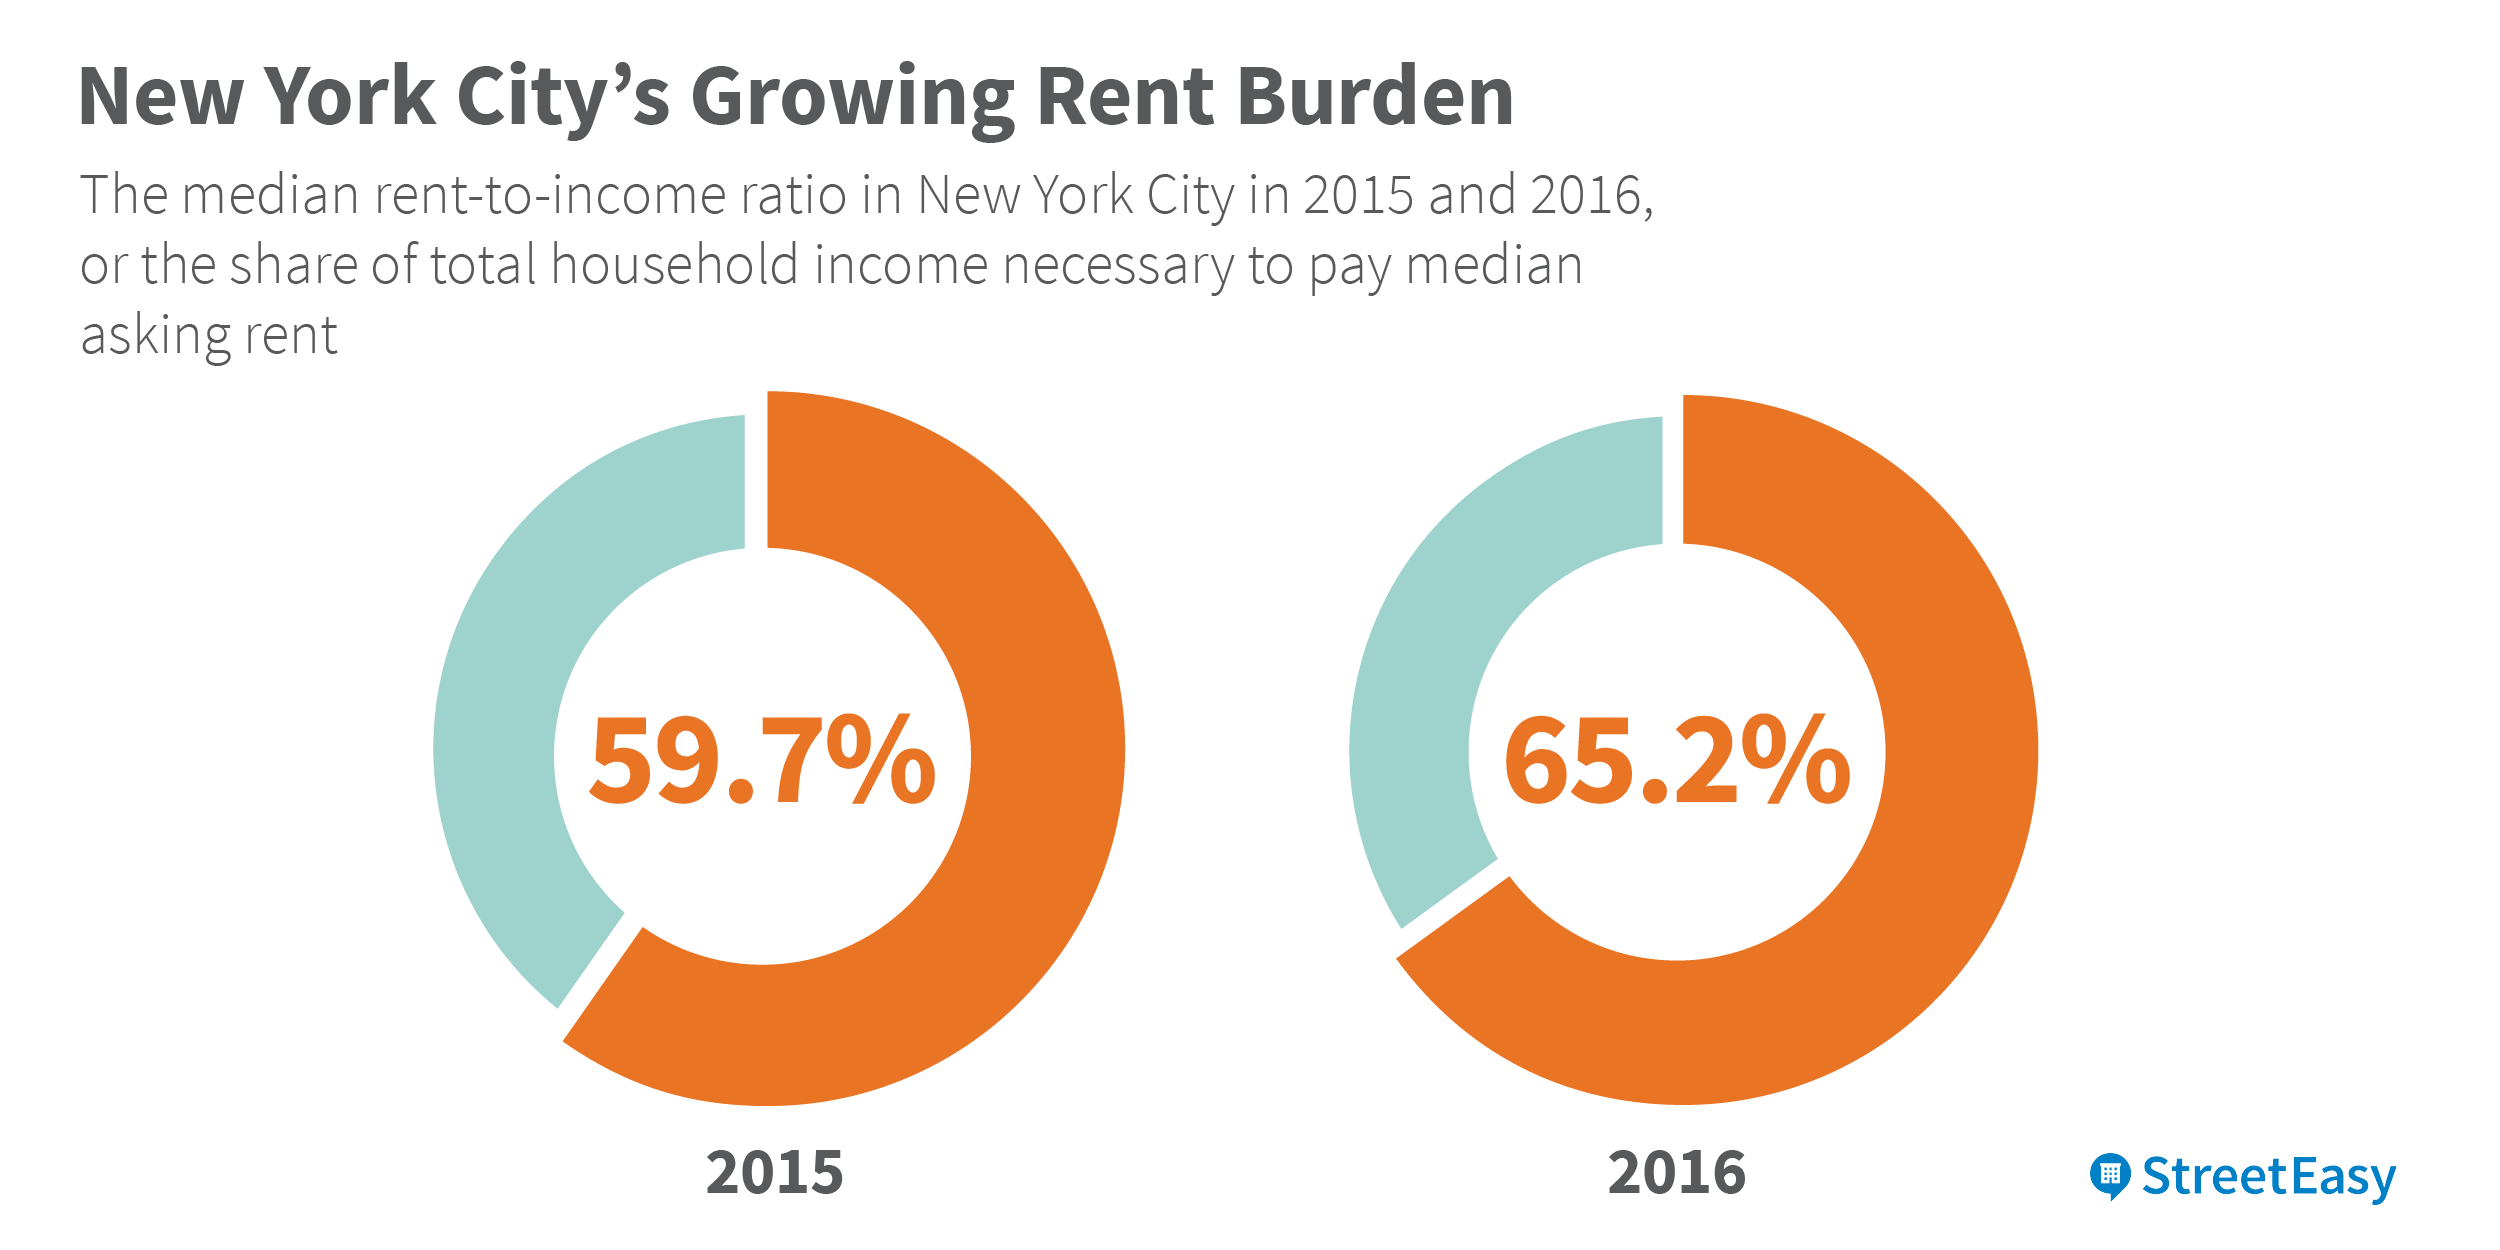
New data provides quantitative evidence of the widening gap between what New York City households can afford and what they are likely to find in the city’s increasingly expensive and competitive private rental marketplace. According to StreetEasy’s annual New York City Rent Affordability Report, the typical New York City household is expected to spend nearly two-thirds of its annual income on market-rate rent this year, a considerably greater burden than just last year[i].
Using the median rent-to-income ratio, which measures the share of income spent on rent, the typical household in New York City is expected to spend 65.2 percent of its total income on market-rate rent in 2016. That figure was 59.7 percent in 2015, an alarmingly high figure in its own right but nearly six points lower than the forecasted rent burden this year.
For a growing number of renters searching for an apartment in the private rental market (vs. units in buildings that are part of financial assistance or subsidy programs), an affordable place to live is well out of reach. The underlying factor behind New York City’s worsening affordability problem is simple: New Yorkers’ incomes aren’t growing fast enough to keep pace with the rising cost of rent. With the notable exception of Manhattan, rent growth is forecasted to far outpace income growth in each borough in 2016.
Faced with a wider gap between what is affordable and what is available in the rental market, New Yorkers are forced to make difficult decisions. Some resort to taking on more roommates to lower their rent burden, resulting in crowded housing conditions that affect immigrant communities the most. Others simply move further away from the city, lowering their housing costs, but increasing their transit time to major job centers in New York City. For the majority of renters, however, the gap means dedicating a larger share of their paycheck to the costs of housing.
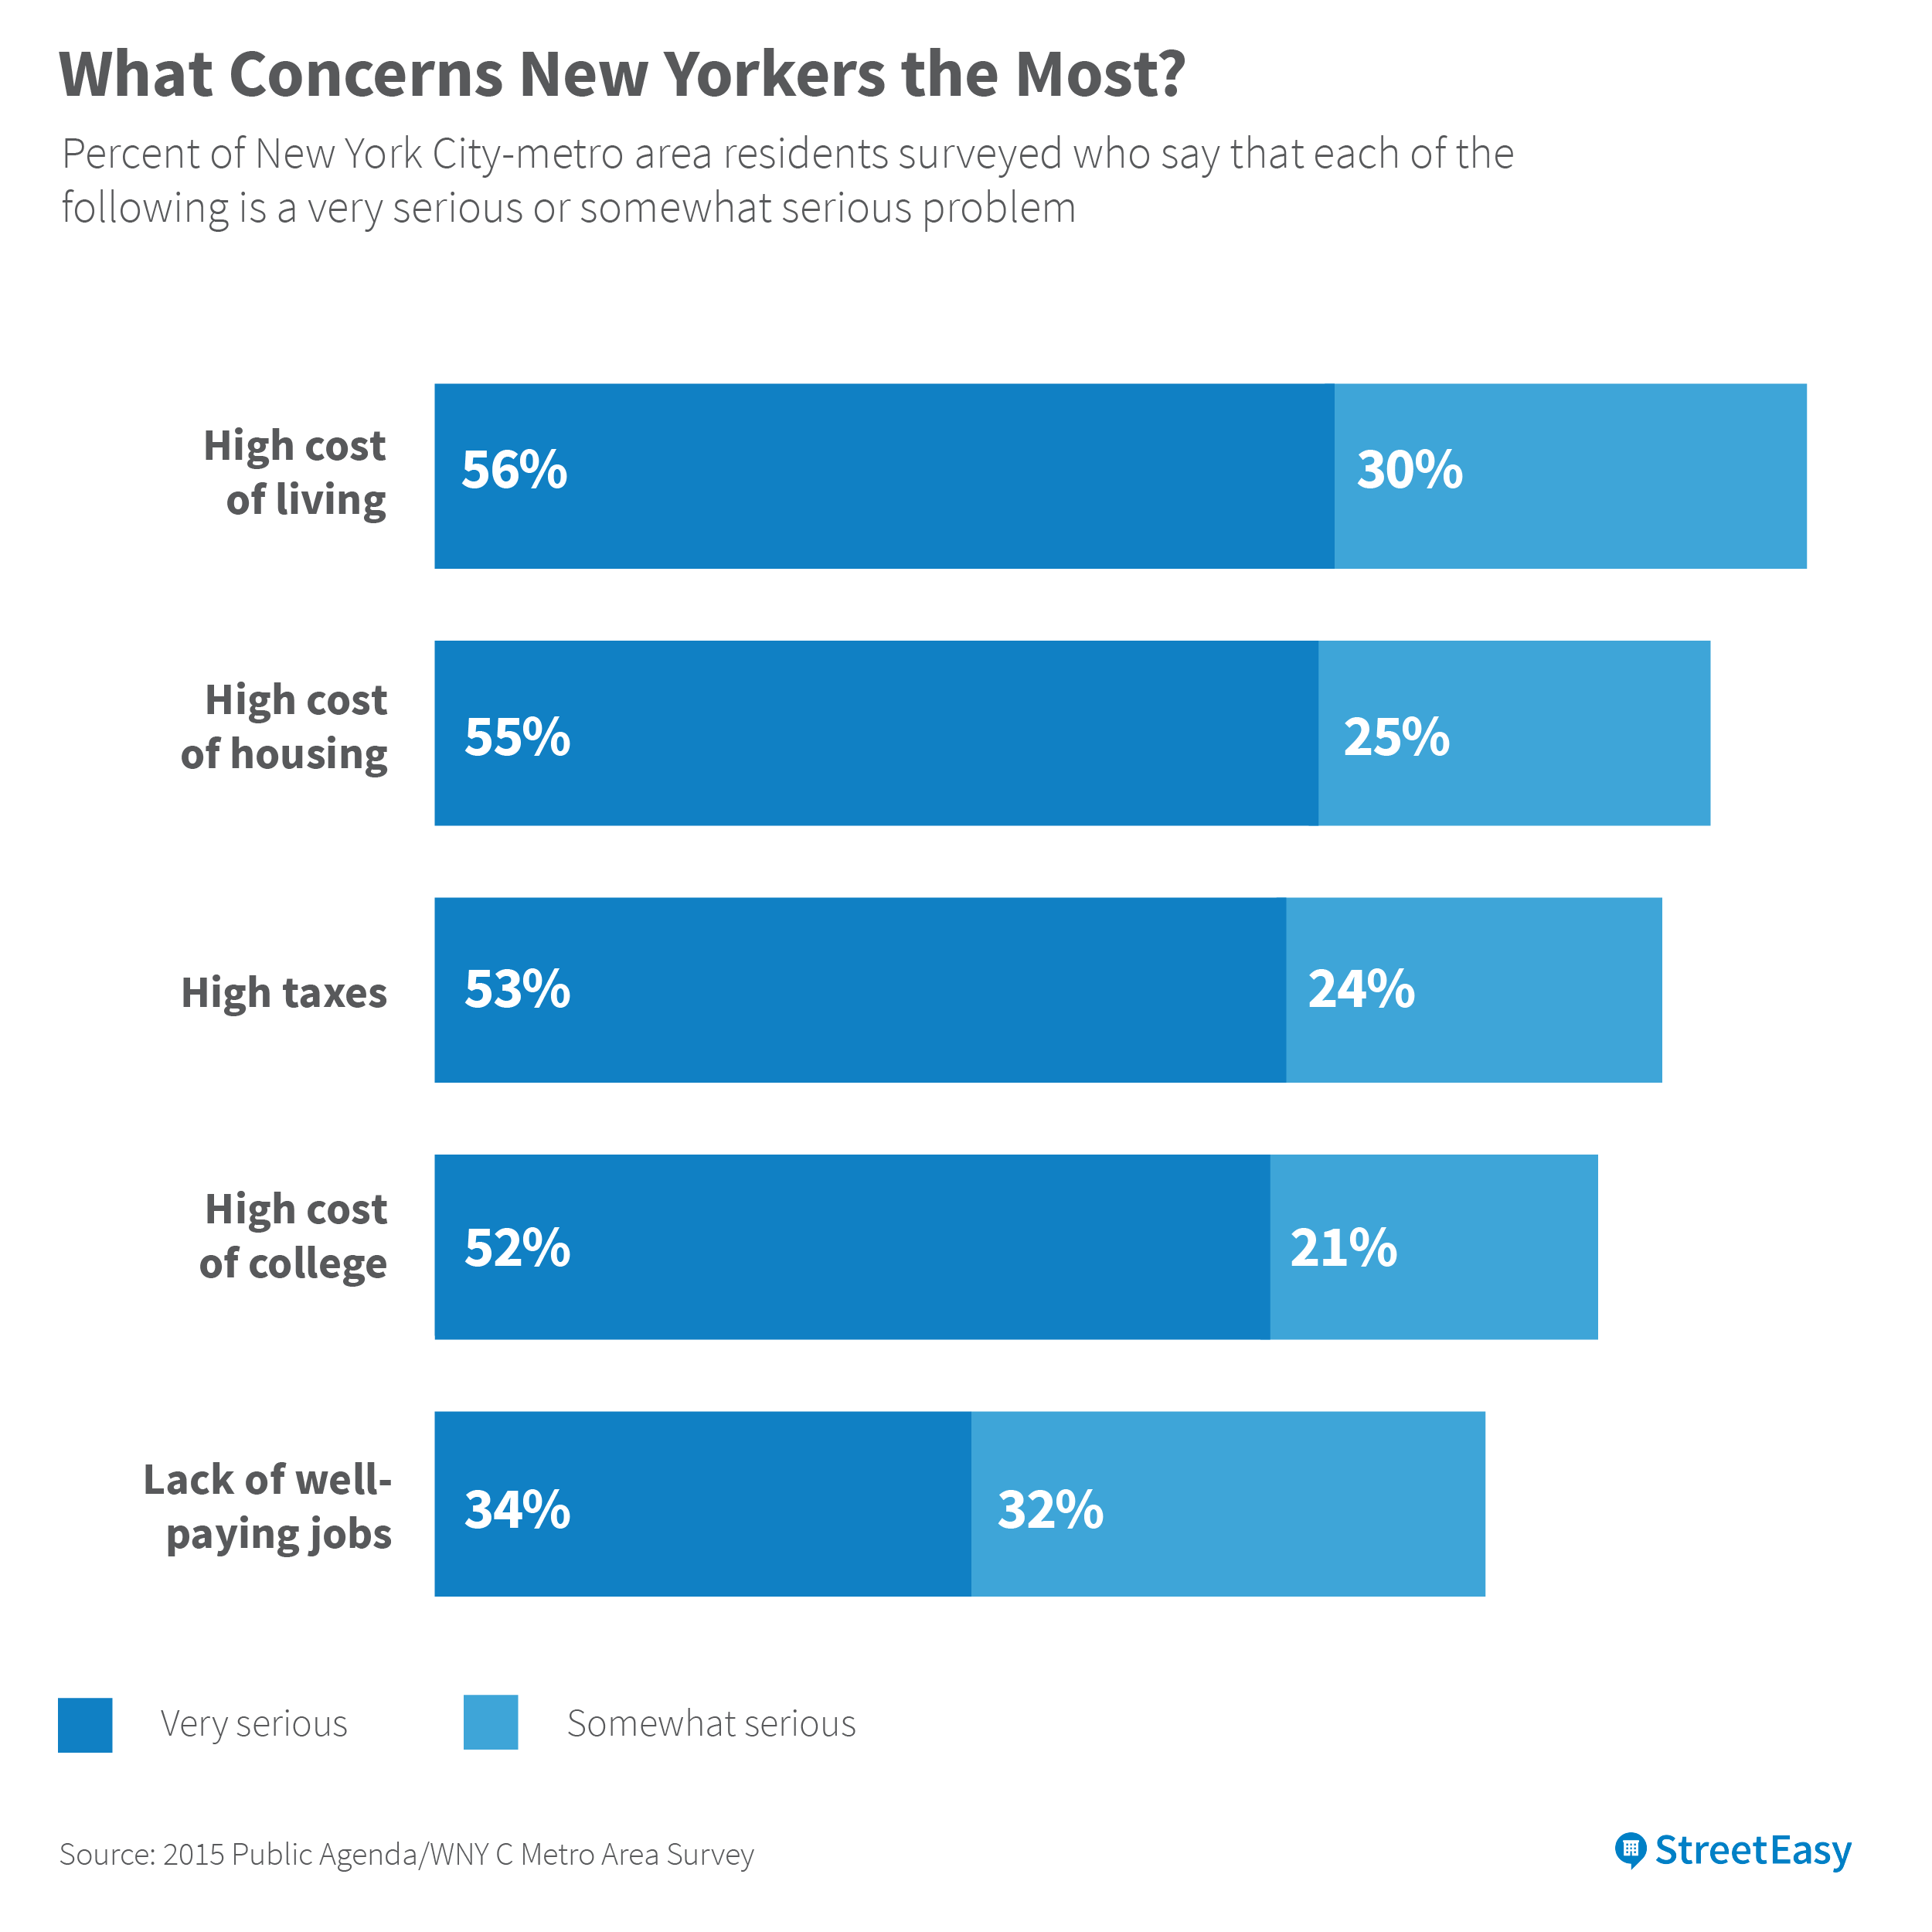
This burden weighs heavily on New Yorkers. According to a recent survey conducted by WNYC radio and Public Agenda, nearly 90 percent of New Yorkers believe that the high cost of housing is a serious problem. The concern about high housing costs was second only to the high cost of living, highlighting how the struggle to afford high rent and other necessities is a clear and growing challenge for New Yorkers.[ii]
Bright Lights, Big(ger) Rent Burden
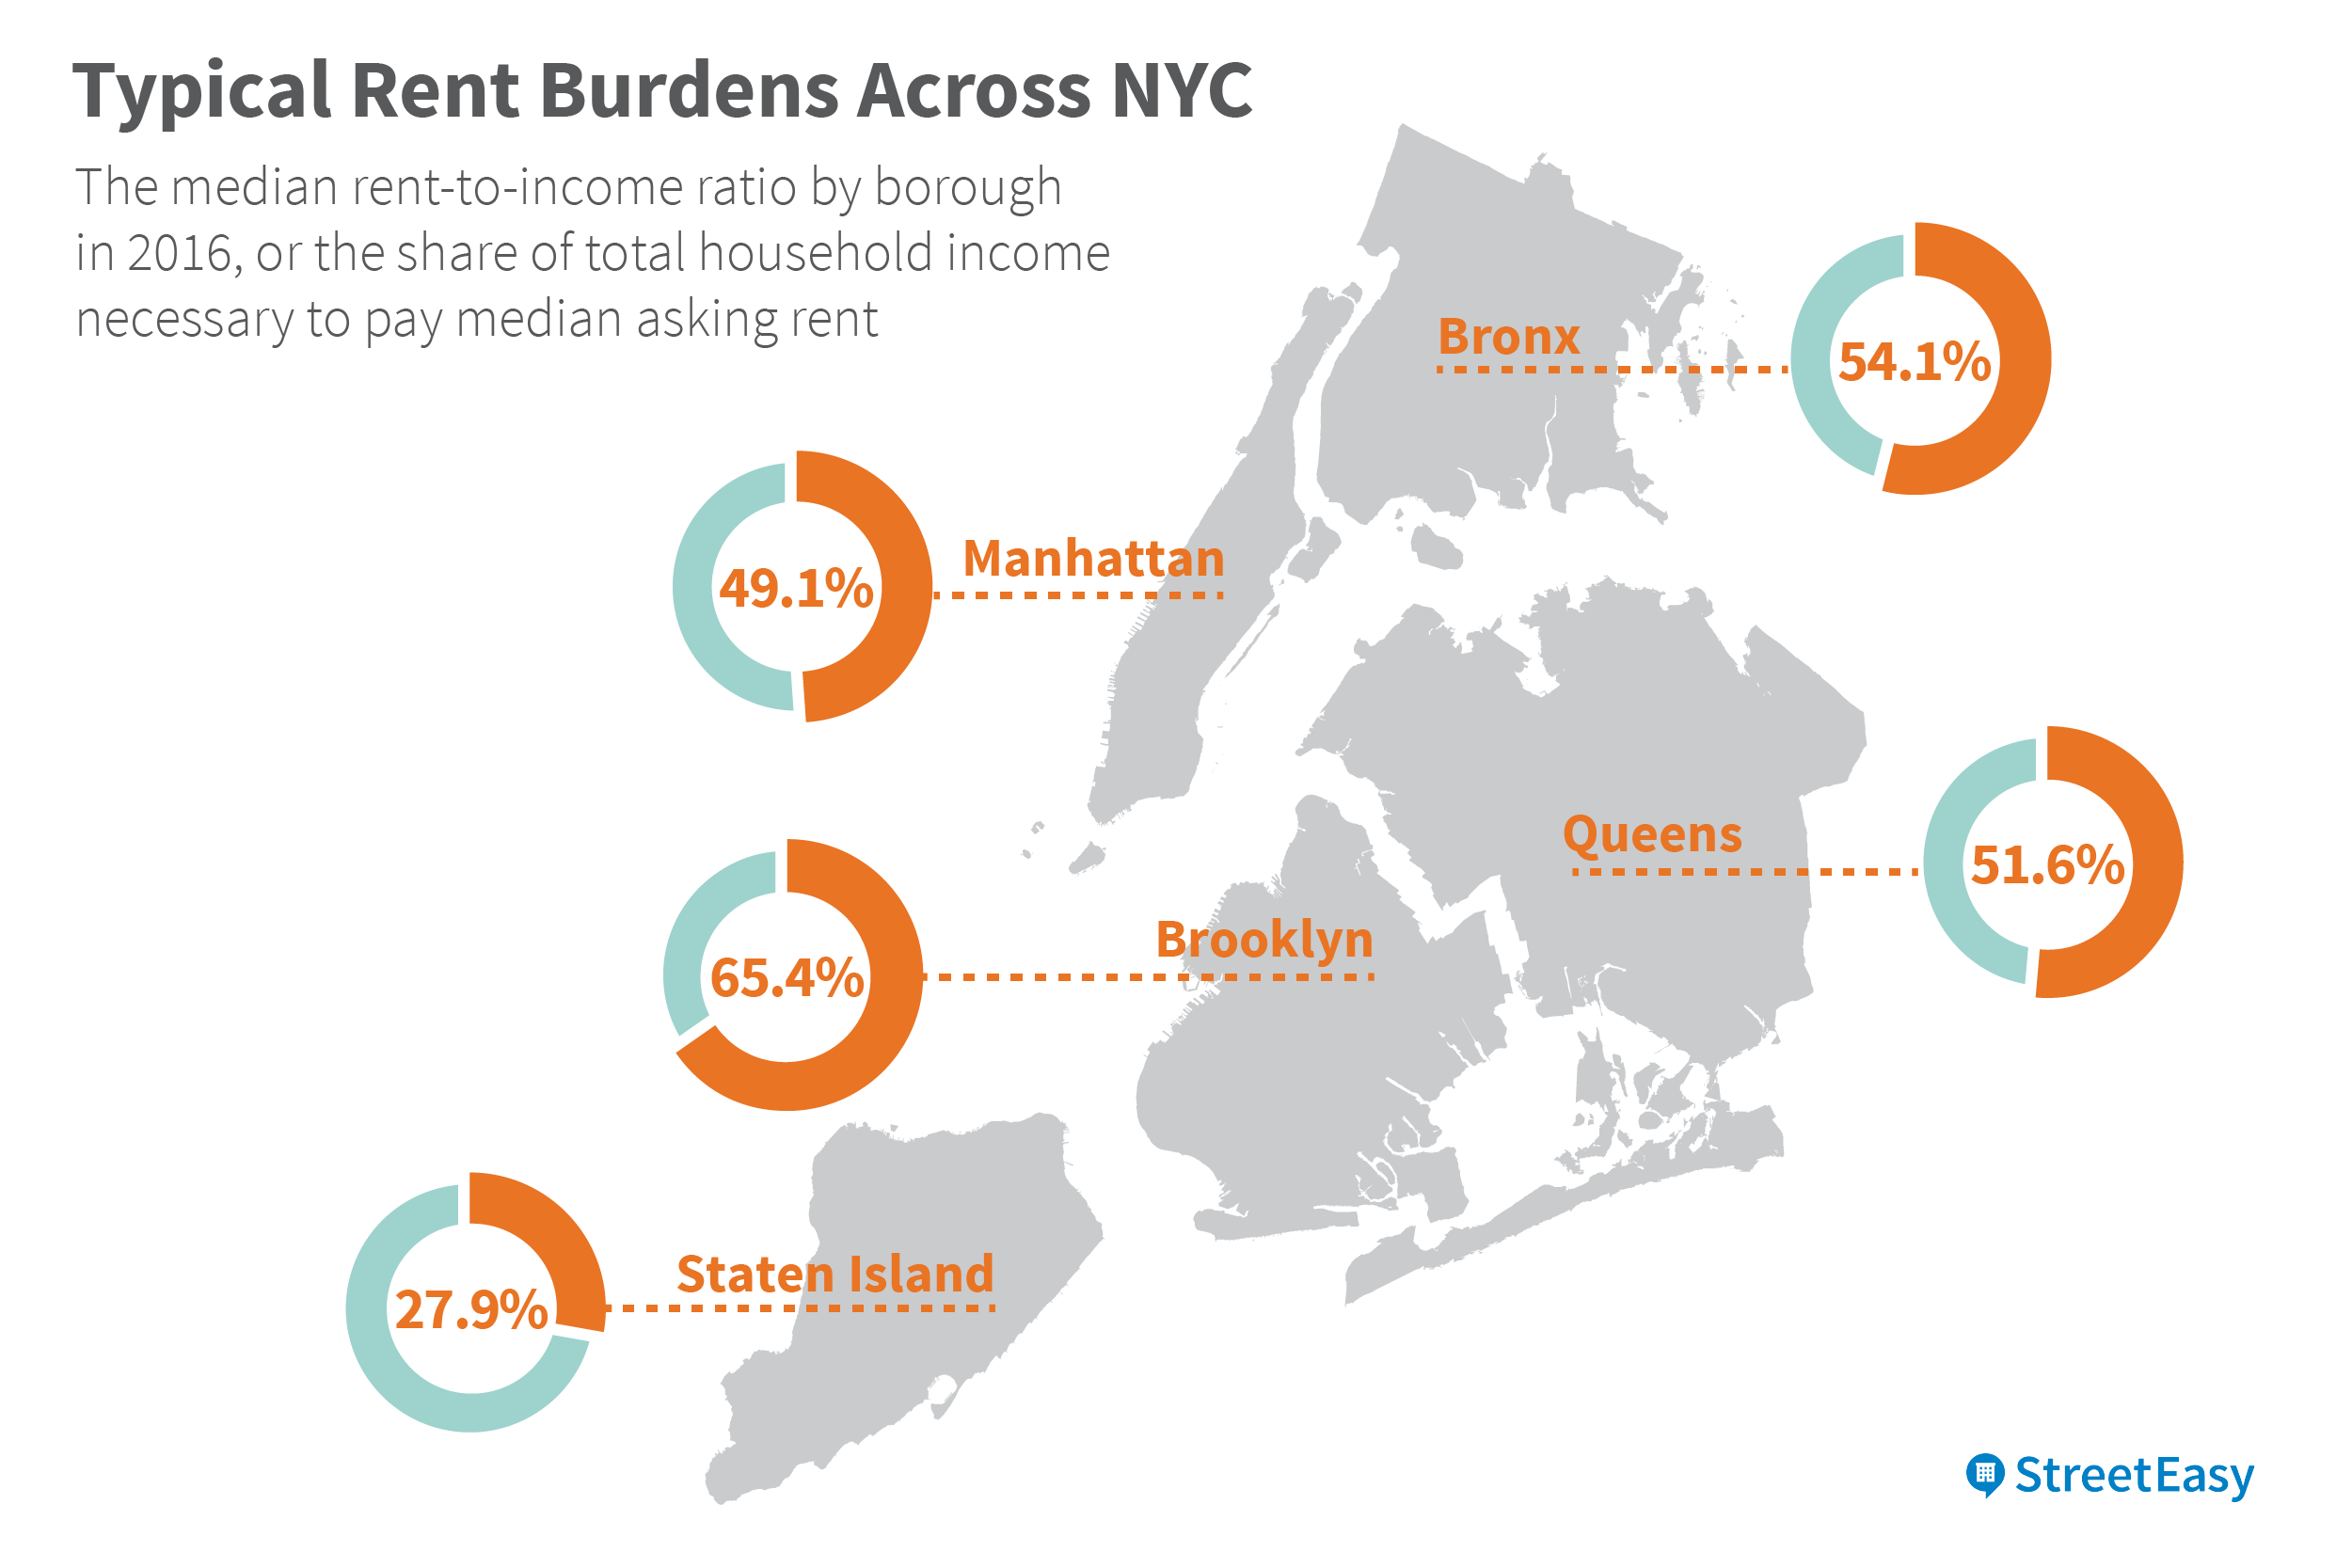
As income growth lags behind rent price growth, New Yorkers in four of the five boroughs can expect to face a higher rent burden in 2016 than in previous years. According to StreetEasy forecasts of asking rent and household incomes, Brooklyn remains the least affordable among the city’s boroughs. The typical household in Brooklyn will need to spend 65.4 percent of its total annual income on the median market-rate rent in 2016. Brooklyn is followed by the Bronx (54.1 percent), Queens (51.6 percent), Manhattan (49.1 percent) and Staten Island (27.9 percent). [iii]
As the least rent burdened borough, Staten Island is home to seven of the 10 neighborhoods in New York City with the lowest median rent-to-income ratio in 2016, including the four lowest: Greenridge (18.8 percent), Princes Bay (19.2 percent), Pleasant Plains (21.1 percent) and Woodrow (21.1 percent).
Conversely, the burden is greatest for households in East Brooklyn, Upper Manhattan and the South Bronx. In Manhattanville, for example, the median rent-to-income ratio is forecasted to reach 119.5 percent in 2016, meaning the annualized median market-rate rent in the neighborhood is far greater than the typical household’s total annual income.[iv] Manhattanville is not alone: Chinatown, Little Italy, Mott Haven and North New York all have median rent-to-income ratios greater than 100 percent, pointing to neighborhoods in the city that are most difficult for local residents to secure affordable housing in the private market.
The high burden highlights the growing necessity of housing subsidies and rent-regulated apartments for low-income households. The rental market in New York City is highly regulated to ensure, at least in theory, that the households with the greatest financial need are able to live affordably. Not every household, and in some neighborhoods perhaps the majority of households, will need to pay market-rate rent because of subsidies and rent-regulated units. However, our rent-to-income ratios highlight the highly unaffordable rental landscape that these New Yorkers would face without these programs and subsidies in place.
Rent Burden Grows Across New York
While Brooklyn continues to be the most burdened borough, the median rent-to-income ratio in Queens has seen the greatest increase. Between 2015 and 2016, the median rent-to-income ratio in Queens increased 8.4 points from 43.5 percent to 51.6 percent. Neighborhoods within Queens saw some of the greatest increases in rent burden in the city, led by Murray Hill (8.6 points), Long Island City (4.3 points) and Jamaica (3.7 points).
As the city’s least affordable borough, Brooklyn renters will face an even greater burden this year. Between 2015 and 2016, the median rent-to-income ratio in Brooklyn increased by 3.5 points, led by Seagate (9.4 points), Williamsburg (1.9 points), Bushwick (1.9 points) and Red Hook (1.8 points).
While Staten Island has the city’s lowest typical rent burden, it is expected to grow slightly this year. Between 2015 and 2016, the median rent-to-income ratio increased by 1.3 points from 26.6 percent to 27.9 percent. Neighborhoods within the North Shore submarket, with its proximity to the Staten Island Ferry, experienced the most growth in rent burden this year. Stapleton saw the greatest gain in the borough (2.3 points), followed by Saint George (2.2 points) and Tompkinsville (1.9 points) – all of which are located in the northern tip of the island.
In the Bronx, where both market-rate rent and household income are the lowest among the city’s five boroughs, the typical rent burden is expected to remain the same as last year. Between 2015 and 2016, median rent-to-income ratio increased by 0.9 points from 53.2 percent to 54.1 percent. Neighborhoods within the South Bronx submarket experienced the most growth in rent burden this year. Mott Haven saw the greatest gain in the borough (2.5 points) and also one of the highest rent-to-income ratios in the city at 108.0 percent, followed by North New York (2.3 points) and Longwood (2.1 points).
Low Income Growth Leads to Higher Rent Burden
Perhaps no other factor is more fundamental to the city’s growing rent burden than lagging income growth. Incomes simply cannot keep up with the growing cost of rental housing. The median household income is expected to grow by 0.8 percent to $56,244 in 2016. However, the median asking rent is expected to grow by 10.1 percent to $3,054.
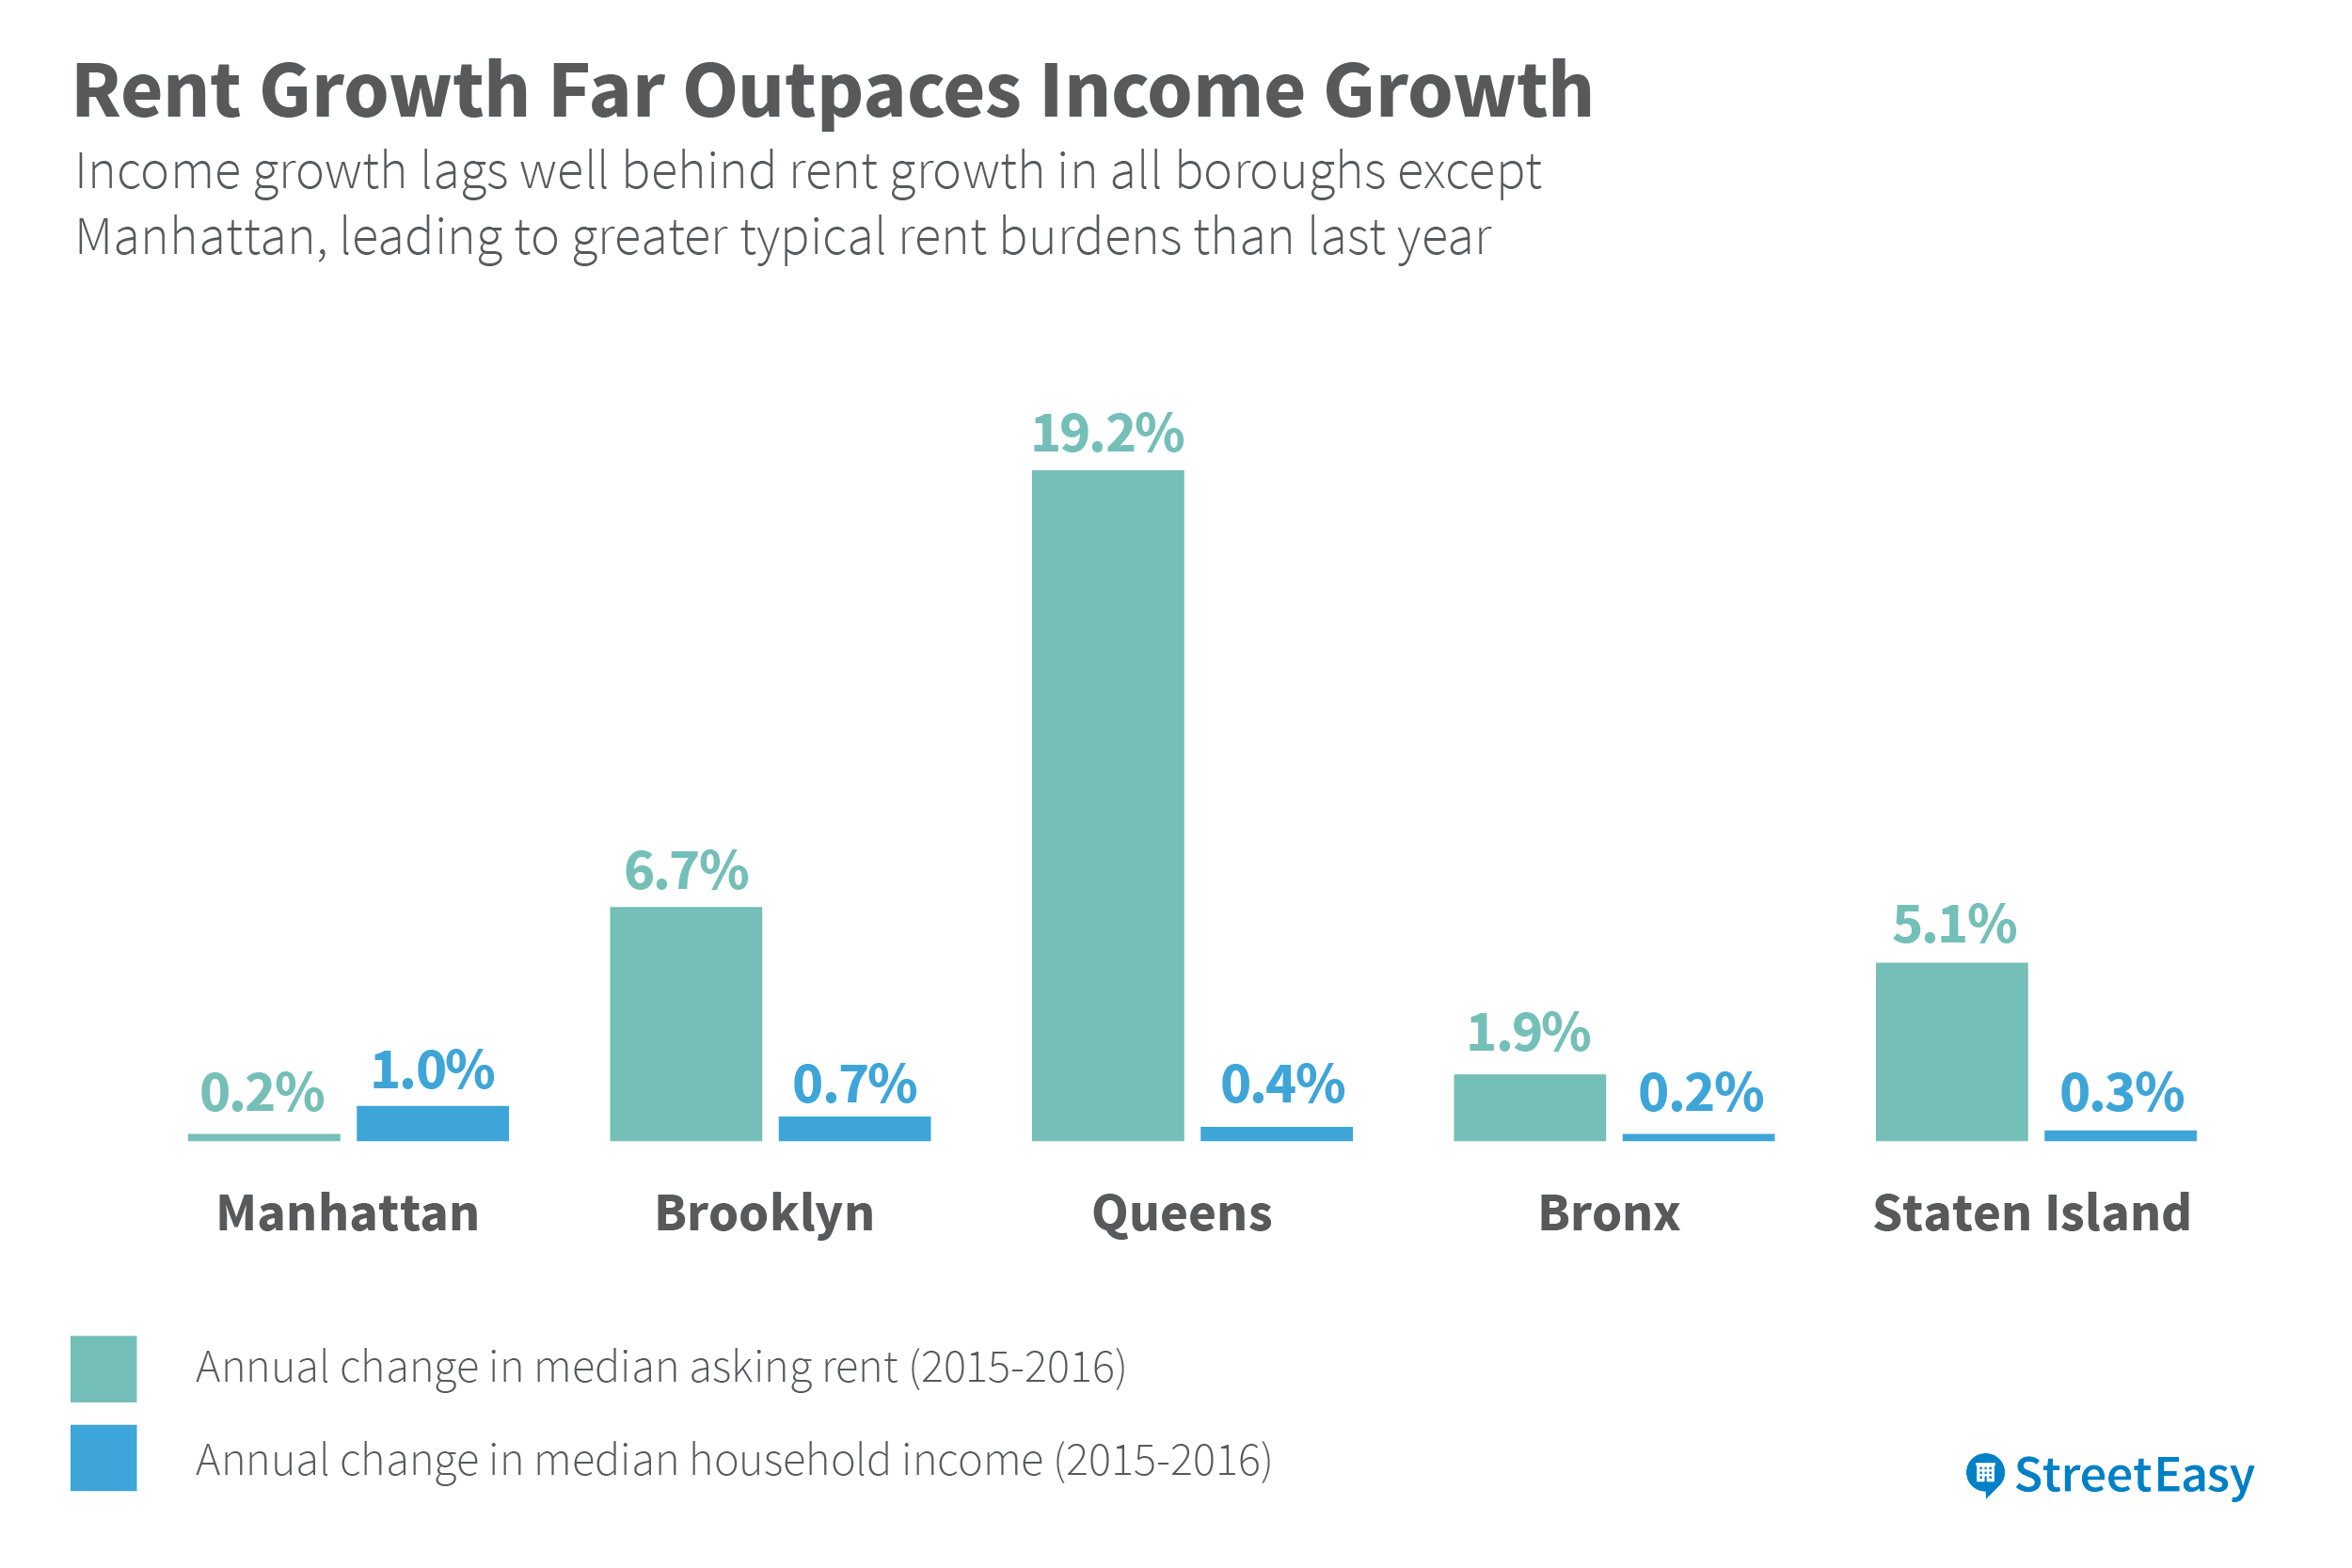
The disparity between rent price growth and income growth is the most severe in Queens, where median asking rent is expected to grow by 19.2 percent to $2,503 and median household income is expected to grow by just 0.4 percent to $58,225. Queens households will consequently experience the greatest increase in rent burden from last year.
Relatively low rent price growth and high income growth in Manhattan will cause a unique phenomenon among the city’s boroughs in 2016: a lower rent burden. Manhattan is the only borough in which the forecasted income growth (1.0 percent) will exceed the forecasted growth in median rent price (0.2 percent). As a result, the median rent-to-income ratio in Manhattan is expected to decline slightly from 49.5 percent in 2015 to 49.1 percent in 2016.
A Path to Affordability
It may be tempting to believe that housing affordability is a problem only for low-income households. In fact, it is every New Yorker’s problem.
A city with an increasingly rent-burdened population risks becoming less competitive in the global economy. As rent consumes a greater share of take-home pay, some of the world’s entrepreneurial talent may choose to live in less expensive cities that afford a higher standard of living. This would be particularly harmful to the economic future of New York City as it seeks to diversify its economy away from a heavy historical reliance on the financial sector. The Big Apple has long attracted the world’s thinkers and doers. But if we shut the door on them with high rent, they may just “make it” elsewhere.
Of course, the problem of housing affordability is most acute for low-income households who often face the greatest burden as incomes fail to keep up with growing rent. Roughly one-third of the city’s labor force is employed in low paying industries such as hospitality and fast-food.[v] The growing gap between what is available to rent in the city and what can be afforded by these households poses a difficult public policy question: is it acceptable for New York to be affordable only to the well-off and highly educated?
Mayor Bill De Blasio’s 10-year affordable housing plan seeks to build or preserve 200,000 rental units in order to keep New York City affordable to households across the full income spectrum. Some of his proposals would rezone neighborhoods to accommodate greater housing density, particularly around transit hubs like East New York. Another initiative of the Mayor’s plan known as mandatory inclusionary housing (MIH) would, true to its name, mandate the provision of affordable units in certain areas of the city in which market-rate apartments are constructed.[vi]
These efforts are aimed at the supply side of the affordability equation and they are sorely needed. With a rental vacancy rate below 3.5 percent, the supply of rental housing across the city is extremely low, which places upward pressure on prices and even more competition among renters.
In order to solve New York City’s affordable housing problem, however, both sides of the equation will need to be addressed. Slowing income growth is not a New York City-specific problem, but it is chiefly responsible for how unaffordable our city has become. Policies aimed at increasing wages and incomes of New Yorkers through training and education should work in concert with increased affordable housing production. Until income growth catches up with rent growth, the rent affordability problem will loom large on New York households.
How We Did It
Median asking rent for each neighborhood in 2015 is based on all rental listings on StreetEasy throughout 2015. Using several years’ worth of rent data, we forecasted median asking rent for each neighborhood in 2016 using a standard auto-regressive integrated moving average (ARIMA) model. Similarly, we forecasted median household incomes in 2015 and 2016 by using the employment cost index (ECI) to adjust 2014 ACS 1-year estimates from the U.S. Census. The rent-to-income ratio for each year is the forecasted median annualized rent divided by the forecasted median household income for each respective year.
Endnotes
[i] StreetEasy’s “State of New York City Rent Affordability” is an annual report that includes the most updated rent-to-income ratios based on historical Census and rent price data.
[ii] 2015 Public Agenda/WNYC New York Metro Area Survey. Results and full methodology can be found here: http://www.publicagenda.org/files/PublicAgenda_Whats_At_Issue_Here_2015.pdf
[iii] All 2016 rent-to-income ratios are based on StreetEasy forecasts of median asking rent and median household income.
[iv] The rent-to-income ratio listed is for each neighborhood is calculated by dividing the forecasted annual median asking rent by the forecasted median household income.
[v] https://nycfuture.org/pdf/Low-Wage_Jobs.pdf
[vi] http://www1.nyc.gov/site/planning/plans/mih/mandatory-inclusionary-housing.page