Key Findings:
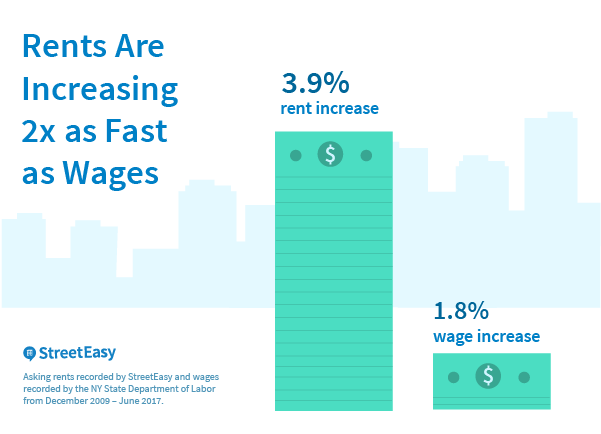
- From 2010 to 2017, New York City rents rose twice as fast as wages. Asking rents increased by 3.9 percent annually, while median wages rose 1.8 percent per year over the same period.
- The city’s lowest earners saw the least amount of wage growth, while the lowest bracket of rents increased the most (4.9 percent annually) since 2010.
- Increases in asking rents far outpaced the 1.2 percent annual increase in the cost of other goods.
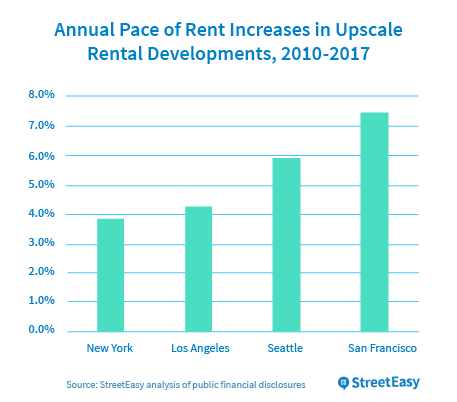
- Rents for upscale units in San Francisco, Seattle and Los Angeles grew at faster paces over the period than New York.
By a variety of measures, rents have risen over the past year at their slowest pace since the end of the recession that followed the global financial crisis. But New York City remains ranked firmly among, if not atop, the country’s most expensive places to live, and for many New Yorkers, rents continue to consume a large share of household income. To get a better sense of how increasing rents affect different New Yorkers, we examined the evolution of both rents and wages from 2010 through June 2017.
Rents Are Up 33 Percent From 2010
As most New Yorkers are aware, housing has become increasingly expensive since the beginning of the recovery from the Great Recession. On average, asking rents in New York City increased by 33 percent from December 2009 through June 2017, an annual pace of 3.9 percent per year.[1] The strongest growth in rents over this period came early in the city’s recovery: Rents grew more than 5 percent annually in 2010, 2011, and 2012, but less than 4 percent in subsequent years. On average, an apartment asking $2,000 per month for rent in 2010 would now ask $2,657 per month.
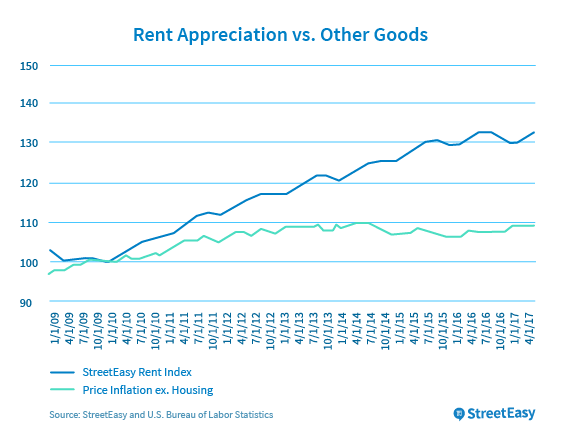
The pace of asking rent growth far outpaced the pace of increases in other goods. Inflation rose 1.5 percent per year over the same period nationally,[2] less than half the average annual growth of the StreetEasy Rent Index. The New York metro area’s consumer price index (CPI), excluding the cost of shelter, increased at an annual pace of just 1.2 percent. The substantially faster pace of rent increases broadly forces renters in New York City to pay a greater share of their disposable income toward housing.[3]
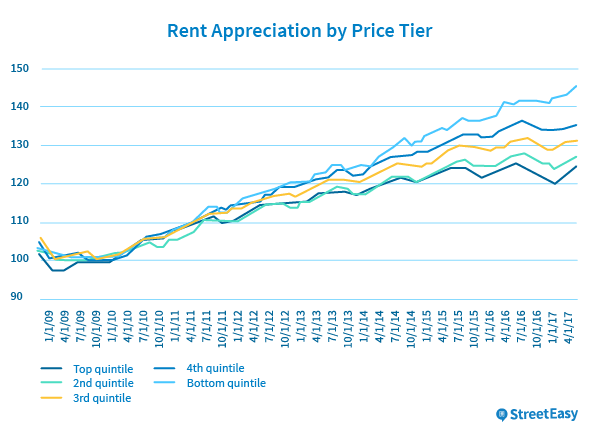
Rents on the Least Expensive Homes Increased the Fastest
Not all rents rose at the same pace. To track the rent across different price segments in the market, we divided rents citywide into five tiers based on their price relative to all rents that year. The figure below shows a striking pattern in the pace of asking rent increases: Since roughly 2012, the rate of growth in rents in different price segments has diverged substantially, with the lowest rents growing at the fastest pace and the highest rents growing at the slowest pace. As measured by our five tiers, rents in the bottom fifth of the market have grown at an annual pace of 4.9 percent since 2010, whereas rents in the top fifth of the market have increased at an annual pace of 3 percent. Though small in annual percentage terms, this amount can accumulate substantially. For a New Yorker paying $1,500 a month in 2010, facing an annual rental growth rate of 4.9 percent instead of 3 percent would require an extra $280 per month in 2017.
Financial relief, in the form of the broader slowdown in the rental market, has likewise been confined to the wealthiest renters. While rents in the top 20 percent of the market have stagnated over the last year, rents in the bottom 20 percent have grown by more than 3 percent.[4]
Mediocre Wage Growth Compounds Unaffordability
Rising rents do not in and of themselves present challenges to affordability, so long as wages for New York renters increase at an equal or greater pace. New York City saw a strong recovery from the recession that followed the global financial crisis, diversifying its workforce into technology and other highly skilled service occupations. As of May, the New York City unemployment rate was 4.4 percent, down from 10.1 percent at the end of 2009[5]. The city added 481,840 jobs between 2010 and 2017, including more than 155,000 jobs in the high-paying management, computer and mathematical, and business and financial operations job families.[6] The table below shows employment levels and median wages by occupational family in 2010 and 2017.
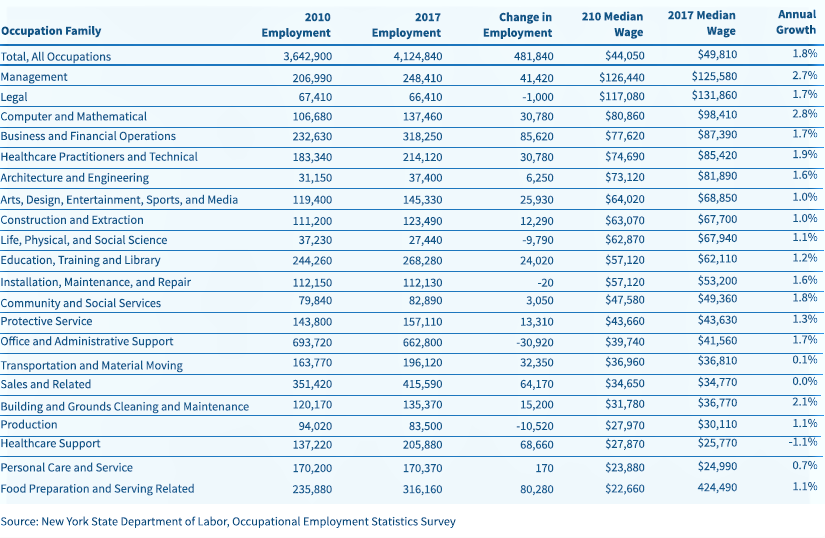
While employment levels have grown at an impressive pace, median wages have grown much more modestly, increasing by 1.8 percent annually since 2010. This stands in stark contrast to asking rents, which increased at more than double that rate (3.9 percent annually) over the same period.
Not all New Yorkers faced the same dilemma; wage gains differed substantially across occupations. As Table 1 shows, for those in computer and mathematical occupations, including software developers, statisticians, and information security analysts, the median wage increased by 2.8 percent between 2010 and 2017, nearly on pace with asking rents.[7] On the other end of the wage spectrum, the median wage for workers in the healthcare support sector, including home health aides and dental assistants, fell by 1.1 percent over the same period. While at opposite ends of the earnings spectrum, both occupations were among those adding the most positions to the New York City workforce over the same period.
Wages for computer and mathematical occupations rank among the top fifth of all occupations (highest earners). Rents for the most expensive segment of the market increased by only 2.6 percent over the same period that wages for computer and mathematical professionals increased by 2.8 percent.[8] Wages for healthcare support occupations rank in the bottom fifth of all professions (lowest earners). Rents for the least expensive apartments increased by 5.1 percent over a period when the median wage for many of the lowest earners stagnated or fell. The slowdown in rent appreciation in many areas over the past year has also primarily benefited those who can afford to pay more than $3,775 per month for an apartment. For a household to be able to afford an apartment at this level without paying more than 30 percent of their income on housing, they would need to earn $151,000 a year — 58 percent more than the city’s median income for a family of four.[9]
When wage increases fail to keep pace with rising rents, many New Yorkers are forced to either spend more of their disposable income on rent and less on other necessities like education, healthcare and saving for the future, or to move to less desirable areas in and outside of the city.
New Housing Helps Keep NYC’s Job Market Competitive
This combination of wage gains and rent increases contains a positive aspect for some: New York remains affordable to those in the uppermost tier of the labor market, including the technology sector that has helped transform cities such as San Francisco, Seattle, and Los Angeles. As New York competes with these cities to lure talent, companies, and jobs that expand and diversify the economic base of the city, the ability to provide quality, affordable homes for these workers remains crucial. These trends suggest that New York has largely succeeded in doing just that. Data aggregated from national developers of upscale rental housing indicates that rents have increased at the slowest pace in New York relative to the other three cities. For two major developers with multiple buildings in all four cities, Equity Residential and Avalon Bay Communities, rents in the New York City area have increased at an annual pace of 3.9 percent since 2010, lower than the 4.3 percent, 5.9 percent, and 7.5 percent increases in Los Angeles, Seattle and San Francisco, respectively.[10]
New York City’s ability to provide attractive housing options for urban professionals has numerous benefits. Foremost, taxes paid by high-earning tenants and their employers ultimately help to support government programs that benefit all New Yorkers. Institutions such as the New York City Housing Authority (NYCHA) and the New York City Health and Hospitals Corporation (HHC) rely on contributions from the city’s tax base. Second, a significant amount of new developments with high rents include subsidized, below-market units for lower-income households in exchange for tax incentives. The New York City’s Mayor’s office has helped create more than 77,000 affordable homes since January 2014, more than 25,000 of which were in new developments. Many of these were a product of affordable allotments in high-rent buildings.[11]
Policy Solutions Struggle to Bridge the Gap
The most prominent source of relief for those unable to meet the demands of increasing monthly rents is the public sector, which provides low- and middle-income New Yorkers assistance through a mix of public housing stock, rental subsidies, and incentives for affordable housing developers. As of 2012, New York City Housing Authority (NYCHA) tenants accounted for more than 7,500 employees of organizations essential to the city’s day-to-day functioning, such as the New York City Department of Education, New York City Police Department, Metropolitan Transportation Authority, and New York City Health and Hospitals Corporation.[12] Yet as of March 2017, nearly 400,000 families remained on waiting lists for subsidized housing from NYCHA[13], and affordable housing lotteries met demand for only a small fraction of applicants. With NYCHA facing a $17 billion capital shortfall[14] and affordable housing lotteries continuing to face heavy demand and an uncertain future in the New York State legislature, rent affordability promises to remain a challenge for many New Yorkers.
Housing policy cannot fix the affordability crisis on its own; policies enabling New Yorkers to qualify for better-paying jobs are an equally important part of the equation. The success of both Governor Andrew Cuomo’s recent legislation to make public universities tuition-free to students from low and middle income families and Mayor Bill de Blasio’s ambition to create 100,000 “good-paying” jobs over the next 10 years is crucial to allowing New Yorkers to gain in the city’s ongoing economic expansion. Combining these workforce and education policies with efforts to protect those at greatest risk in the housing market is critical to ensuring a prosperous and equitable future for the city and the residents who call it home.
Endnotes
[1] At StreetEasy, we track the evolution of rents through our StreetEasy Rent Index, which we report across boroughs, and across submarkets and price tiers within boroughs. For the purposes of this analysis, we calculated a single rent index covering all of New York City. See this discussion of the methodology underlying StreetEasy’s index calculations.
[2] As measured by the headline consumer price index (CPI). Source: U.S. Bureau of Labor Statistics
[3] This implication requires the assumption that the relative pace of asking rent increases is reflective of the broader rental market. StreetEasy’s Rent Index reflects only asking rents for market rate units for rent at a given point in time.
[4] As of June 2017.
[5] Seasonally adjusted. Source: U.S. Bureau of Labor Statistics.
[6] According to the New York State Department of Labor’s Occupational Employment Statistics
[7] Median wages across occupations do not necessarily track the trajectory of wages for a given individual over the period in question and can increase and decrease based upon structural changes within the profession (i.e., creating or eliminating higher or lower paying roles). Still, median wages are broadly indicative the general earning potential of the occupation family, including opportunities for advancement that can increase wages over time.
[8] Wage data reflects Q1 2010 and Q1 2017. Comparable rent appreciation is measured over the same period.
[9] Source: Department of Housing and Urban Development.
[10] Source: same store analysis in financial disclosures from Equity Residential and Avalon Bay Communities.
[11] Source: New York City Mayor’s Office.
[12] Source: HR&A Advisors, “Economic Impact of the New York City Housing Authority in New York City and New York State.” September 12, 2013.