The StreetEasy Market Reports include extensive data and analysis for Manhattan and Brooklyn. Below are Brooklyn highlights. If you would like to read about the Manhattan market, click here.
Brooklyn Report Highlights:
- Bidding Wars in Brooklyn: Bidding wars were the rule, not the exception and nearly half of Brooklyn’s neighborhoods had sale-to-list price ratios at or above 100 percent, meaning sellers received their full asking price or more.
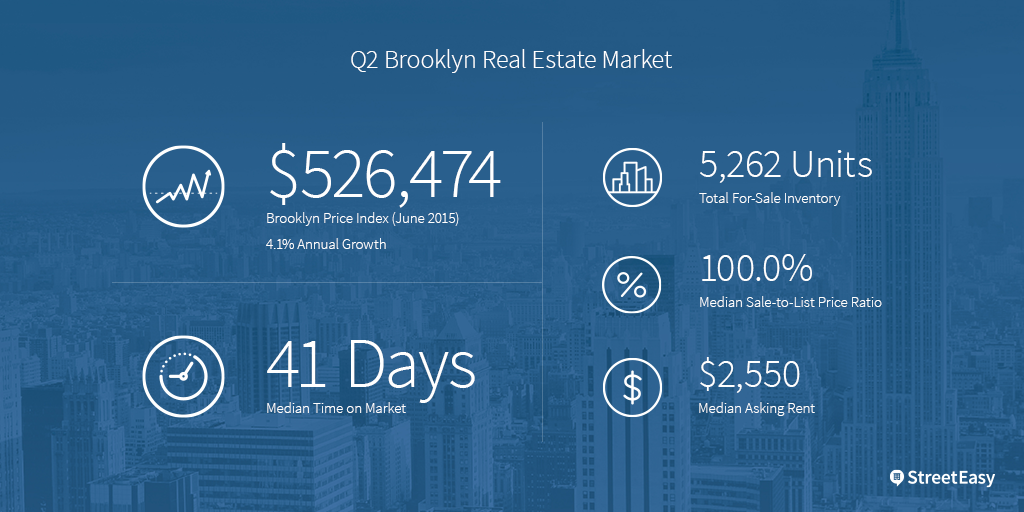
- Record-High Prices: The Brooklyn Price Index reached an all-time high of $526,474, with prices growing by 4.1 percent.
- Brooklyn Homes Sold Faster than Manhattan Homes: The median time on market of homes that went into contract in Brooklyn was 41 days – three days shorter than Manhattan homes, with homes priced in the top price tier spending the shortest amount of time on the market.
- Brooklyn Two-Bedroom Rents Drop: Price trends in the second quarter could spell relief for Brooklynites. The median asking rent of $2,550 was essentially flat from last year, though two-bedroom rentals saw the greatest price drop with the median asking rent declining 7.4 percent from last year to $2,500.
Record-High Prices in Brooklyn, but Price Growth Slows with Inventory Influx
The median resale value of all Brooklyn homes reached an all-time high at the close of the second quarter according to StreetEasy’s Brooklyn Price Index (BPI), although annual price growth slowed to less than half the 2014 annual growth rate. While the resale value of Brooklyn homes grew by 10.1 percent in 2014, the year-over-year price growth in June 2015 slowed to 4.1 percent.
The small, but rising number of homes available for sale has helped to slow price growth in Brooklyn. Although the number of homes available for sale throughout the second quarter was 5,262 homes — a jump of 17.4 percent from last year — it was still less than half (44.6 percent) of the total number of homes available for sale in Manhattan. Inventory grew in all five of Brooklyn’s submarkets, although the strongest growth was seen in East Brooklyn, which includes Crown Heights, Bedford-Stuyvesant, Bushwick, Brownsville and East New York and North Brooklyn, which includes Williamsburg and Greenpoint.
The Typical Brooklyn Seller Gets 100 Percent of Asking Price
The median sale-to-list price ratio rose by 0.4 percent from last year to 100.0 percent in the second quarter, meaning Brooklyn home sellers could expect to receive most, if not all of their initial asking price in the final sale of their home. Sale-to-list price ratios exceeded 100 percent in the Prospect Park (101.8 percent) and East Brooklyn (101.2 percent) submarkets, which were fertile grounds for bidding wars as buyers fiercely competed for available units in those areas. Other key price indicators show that sellers retain more of the bargaining power in Brooklyn. The share of all homes for sale that saw a price cut fell by 4.4 percent from last year to 21.2 percent in the second quarter, and the median discount between initial asking price and final recorded sales price fell to 5.65 percent.
Brooklyn Homes Sell Faster Than Manhattan Homes
Despite the growth in prices, Brooklyn buyers were quick to close on sales in the second quarter. The median time on market of homes that went into contract was 41 days – three days shorter than Manhattan homes during the same quarter, but six days longer than last year. Homes sold the quickest in the Prospect Park submarket (31 days), followed by North Brooklyn (35 days), Northwest Brooklyn (36 days), South Brooklyn (55 days) and East Brooklyn (58 days). The demand for higher-priced homes in Brooklyn was particularly acute in the second quarter. Homes priced in the top price tier (above $716,000) took just 36 days to sell, whereas homes priced in the bottom price tier (below $381,000) took 54 days to sell, indicating that newer or higher-quality units in Brooklyn were far more attractive to existing buyers than older and perhaps lower-quality listings.
Brooklyn Rents Dip Slightly
Renters in Brooklyn face the highest rent burden in the city according to a recent StreetEasy study, although price trends in the second quarter could spell relief for Brooklynites. The median asking rent fell 1.0 percent from last year to $2,550. Two-bedroom rentals saw the greatest price drop, with the median asking rent declining 7.1 percent from last year to $2,500. The most expensive submarket was North Brooklyn, with a median asking rent of $3,100, followed by Northwest Brooklyn ($2,990), Prospect Park ($2,650), East Brooklyn ($2,400) and South Brooklyn ($1,800).
To read highlights from the Manhattan Market Report, click here.
For additional data and graphics for both boroughs, download the full report as a PDF here.

