May 2026 NYC housing market report
Key takeaways:
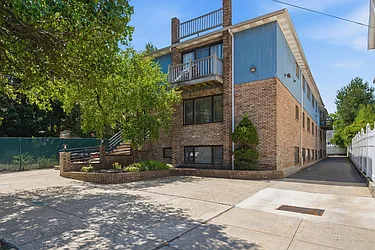
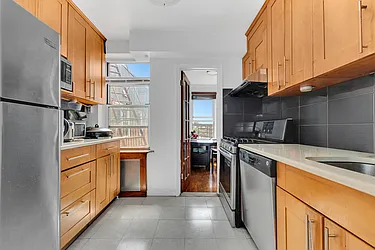
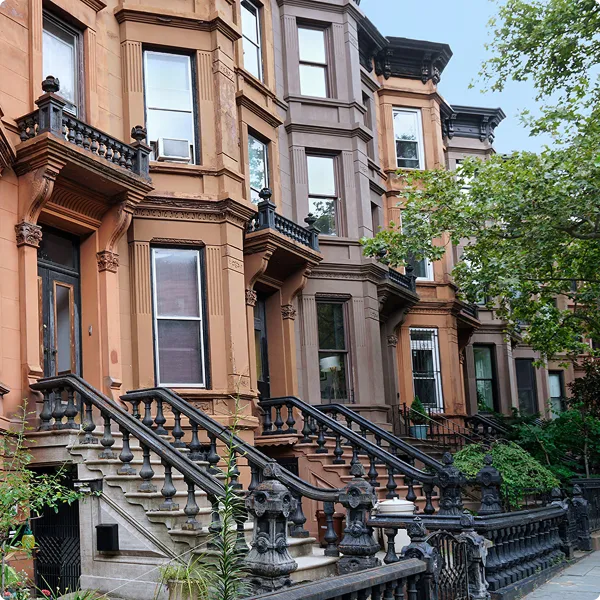
NYC rental market
- After accounting for structural effects such as the city’s decades-long housing shortage, the FARE Act was associated with a 1.1% increase in average asking rents for broker-represented rentals — about $46 more per month — while renters avoided an average upfront broker fee of $5,862.
- With the NYC metro facing a housing deficit of at least 400,000 homes, NYC’s chronic housing shortage is setting the course for the city’s rental market.
- As a result, renters faced much tougher competition than before the pandemic, as the average NYC rental received 63.6% more inquiries than in May 2019.
- As demand continued to outpace supply, the NYC median asking rent rose 7.3% year-over-year to $4,199 in May, the highest on StreetEasy record since 2010.
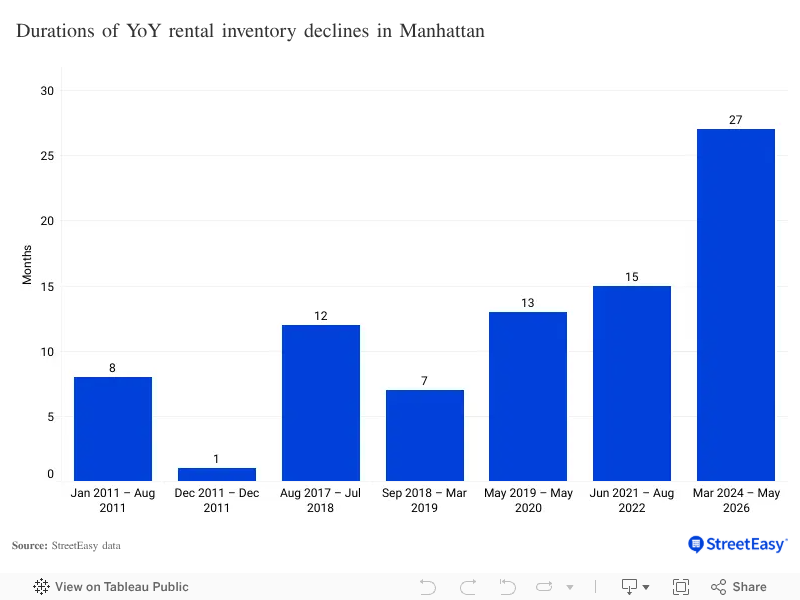
- Manhattan remained the city’s most competitive rental market, with the borough experiencing its 27th consecutive month of annual inventory decline in May.
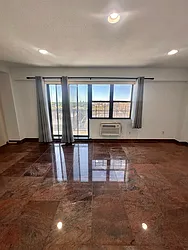
NYC sales market
- Even as the national market stalled amid rising mortgage rates, the NYC sales market marched forward with 2,427 homes entering contract in May: the highest in four years.
- In Manhattan, the city’s deep pool of well-resourced buyers contributed to strong contract activity in the high end of the market.
- Buyers are likely to experience the least room for negotiation in Brooklyn, where homes sold for a median of 98.5% of their latest asking price in May.

NYC rental market
The FARE Act, effective as of June 2025, requires that renters only pay a broker fee if they hire the broker and that listings clearly disclose all fees upfront. One year after the FARE Act’s implementation, market data continues to indicate that long-term structural forces, such as an undersupply of new housing relative to resilient demand, remain the main driver of the recent acceleration in rent growth in New York City.
Demand has been outpacing supply since well before the FARE Act, draining the city’s rental inventory. Across NYC, 33,064 rentals were on the market in May 2026, down 10.7% from a year ago. Inventory in Manhattan fell 13.0% year-over-year to 15,489 units, the 27th consecutive month of annual decline. The current streak is a year longer than the previous longest streak of declines — 15 months between June 2021 and August 2022 — when the resurgence of demand following return-to-office policies depleted inventory.
As demand from Manhattan spills across the rivers, the outer boroughs have also faced declines in rental supply. In Brooklyn, rental inventory declined 7.3% year-over-year to 12,149 in May. Besides a short-lived annual increase in March, inventory in Brooklyn has been falling year-over-year since July 2025. In Queens, there were 4,380 rentals on the market in May, 11.2% below a year ago. While new developments in Brooklyn and Queens increased rental supply over the past five years, the city still needs more housing to alleviate the strain of persistent demand amid low vacancy rates.
The city’s housing shortage has been decades in the making. While housing production has ramped up over the past five years, the city still faces the worst housing shortage in the United States. Zillow research shows the NYC metro area still needs more than 400,000 homes just to fulfill unmet demand from individuals or families doubling up in a home with non-relatives — greater than the Chicago, Boston, and San Francisco metro areas combined.
As a result, NYC renters faced fierce competition in May, with the city’s average listing receiving 63.6% more inquiries than in May 2019 before the pandemic disrupted the rental market. In Manhattan, the most competitive borough for renters, the average listing saw 69.8% more inquiries. Against this backdrop, the citywide median asking rent rose 7.3% year-over-year to $4,199 in May, a new high since StreetEasy began tracking the data in 2010. Manhattan reached a new StreetEasy high, with the borough’s median asking rent up 7.2% year-over-year to $4,927, while Brooklyn also hit a record, rising 6.7% to $3,895. In Queens, the median asking rent climbed 6.4% to $3,350, its highest since July 2025.
With the severe supply shortage setting the course for the city’s rental market, the FARE Act has had limited impact on price trends since its implementation on June 11, 2025. Among broker-represented rentals in May 2026, those that previously charged tenants a broker fee saw a 6.4% average increase per year in asking rent since the last time they were on the market. This is only modestly higher (1.6 percentage points) than the 4.8% average increase per year for rentals that never charged a broker fee. The rent increases were calculated on an annualized basis after factoring in any concessions, to account for differences in the time it took for the units to return to market.

The FARE Act’s impact on prices was likely even lower when accounting for structural market trends, seasonality, and property-specific differences such as the building, bedroom count, and amenities. After controlling for these effects, we estimate the FARE Act was associated with a 1.1% increase in average asking rents among units still represented by agents or brokers.
Our new estimate, updated with new data since December, is about the same as in our previous report. While the methodology is the same, our new estimate relies on a larger dataset with more than 290,000 homes relisted as rentals by agents or brokers on StreetEasy between January 2021 and May 2026. The stability of our estimate is consistent with the conclusion that other factors, such as structural trends and local market dynamics, continue to dominate price trends.
NYC rentals under $3,500 on StreetEasy Article continues below


While the FARE Act has led to small rent increases for tenants, renters save thousands of dollars upfront when signing a lease. In May, the net-effective average asking rent of broker-represented rentals was $4,117. The estimated 1.1% impact implies the asking rent for these units would have been $4,071 without the FARE Act in place, a modest difference of $46. In exchange for $46 more in monthly rent, renters save an average of $5,862 at lease signing — the hypothetical average broker fee they would have had to pay in May 2026 without the FARE Act.
Renters should continue to expect tough competition and elevated rent growth this year. While lower than last year, elevated mortgage rates have been keeping many potential buyers on the sidelines, compelling them to remain in the rental market. Moreover, structural issues such as overly restrictive zoning, lengthy approval processes, and high construction costs have been constraining the city’s rental supply. Improving housing supply through policies such as additional zoning changes and streamlined approval processes would be one of the most durable solutions to chip away at the city’s housing deficit.
NYC sales market
The NYC sales market marched forward in May even as the recent increases in mortgage rates cooled the national market. The number of homes entering contract in NYC jumped 14.8% from a year ago to 2,427 — the highest since May 2022. While delayed activity following colder-than-usual weather in January and February was likely a factor, the solid contract activity in May indicates strong pent-up demand from NYC buyers who had been sidelined by high mortgage rates over the last few years, even as recent increases eroded some of the improvement in affordability.
In Manhattan, 1,155 homes entered contract in May, up 13.2% from a year ago and the highest in four years. The city’s deep pool of well-resourced buyers contributed to strong contract activity in the high-end market. The most expensive third of Manhattan, priced above $2.3M as of May, saw a 24.1% jump in new contracts from a year ago, outpacing the middle third’s 14.2% increase, priced between $900K and $2.3M. With elevated buyer activity, homes that entered contract in Manhattan spent a median of 59 days on the market, five fewer days than a year ago.
NYC Homes Under $1M on StreetEasy Article continues below


Brooklyn also showed solid buyer activity with 704 homes entering contract in May, up 12.3% from a year ago. As inventory rose 15.3% from last year, homes entering contract spent a median of 50 days on the market, an increase of four days from last May. However, buyers should expect the least room for negotiation in Brooklyn, with homes in the borough selling for a median of 98.5% of their latest asking price in May, higher than 97.9% in Manhattan and 97.3% in Queens.
Queens stood out as the only borough with asking price growth, as the median asking price rose 4.5% year-over-year to $685,500 in May. Across the borough, 426 homes entered contract, up 17.4% from a year ago. The co-op market in Queens was active with 192 units entering contract, the most in four years and up 23.9% year-over-year. Co-ops in the borough continue to offer more affordable options than those in Manhattan and Brooklyn. The median asking price for Queens co-ops was essentially flat from last year at $340,000, compared to $425,000 in Brooklyn and $850,000 in Manhattan.
While the city’s spring market this year was strong, with mortgage rates back at nearly 6.5%, the seasonal slowdown in home-buying activity may be more pronounced this year than last. Elevated contract activity suggests NYC buyers have been well-positioned to navigate current market conditions, but the recent jump in mortgage rates has eroded some of the recent affordability improvements that buyers enjoyed earlier this year. Under these circumstances, buyers who can stay on the market will likely be more selective. For sellers, working with an agent to come up with smart pricing and marketing strategies to build early momentum would be essential.
NYC market data: May 2026
Rentals
 NYC |
 Manhattan |
 Brooklyn |
 Queens | |
|---|---|---|---|---|
| Median asking rent | $4,199 (+7.3% YoY) | $4,927 (+7.2%) | $3,895 (+6.7%) | $3,350 (+6.4%) |
| Number of homes for rent | 33,064 (-10.7%) | 15,489 (-13.0%) | 12,149 (-7.3%) | 4,380 (-11.2%) |
| Share of rentals with price cuts | 10.8% (-1.6pp) | 11.9% (-1.6pp) | 10.8% (-1.1pp) | 8.4% (-3.0pp) |
| Share of rentals offering concessions* | 13.8% (+1.9pp) | 11.1% (+3.0pp) | 14.6% (+1.6pp) | 16.9% (-0.9pp) |
Sales
|
NYC |
Manhattan |
Brooklyn |
Queens | |
|---|---|---|---|---|
| Median asking price | $1,040,000 (-3.3% YoY) | $1,398,000 (-3.6%) | $1,080,000 (-1.4%) | $685,500 (+4.5%) |
| Number of homes for sale | 17,766 (+10.6%) | 9,089 (+4.8%) | 4,483 (+15.3%) | 3,241 (+21.5%) |
| Homes entering contract | 2,427 (+14.8%) | 1,155 (+13.2%) | 704 (+12.3%) | 426 (+17.4%) |
| Median days on market | 56 (0) | 59 (-5) | 50 (+4) | 57 (+4) |
Thinking about buying in NYC? Chat with our complimentary, licensed Concierge to learn about the buying process.
StreetEasy is an assumed name of Zillow, Inc. which has a real estate brokerage license in all 50 states and D.C. See real estate licenses. StreetEasy does not intend to interfere with any agency agreement you may have with a real estate professional or solicit your business if you are already under contract to purchase or sell property. All data for uncited sources in this presentation has been sourced from Zillow data. Copyright © 2026 by Zillow, Inc. and/or its affiliates. All rights reserved.