
As a real estate agent, your listings are your bread and butter — often the first touchpoint you have with your clients. To help you understand what the listing landscape of NYC is and how you can make yours stand out, check out these helpful graphs and stats.
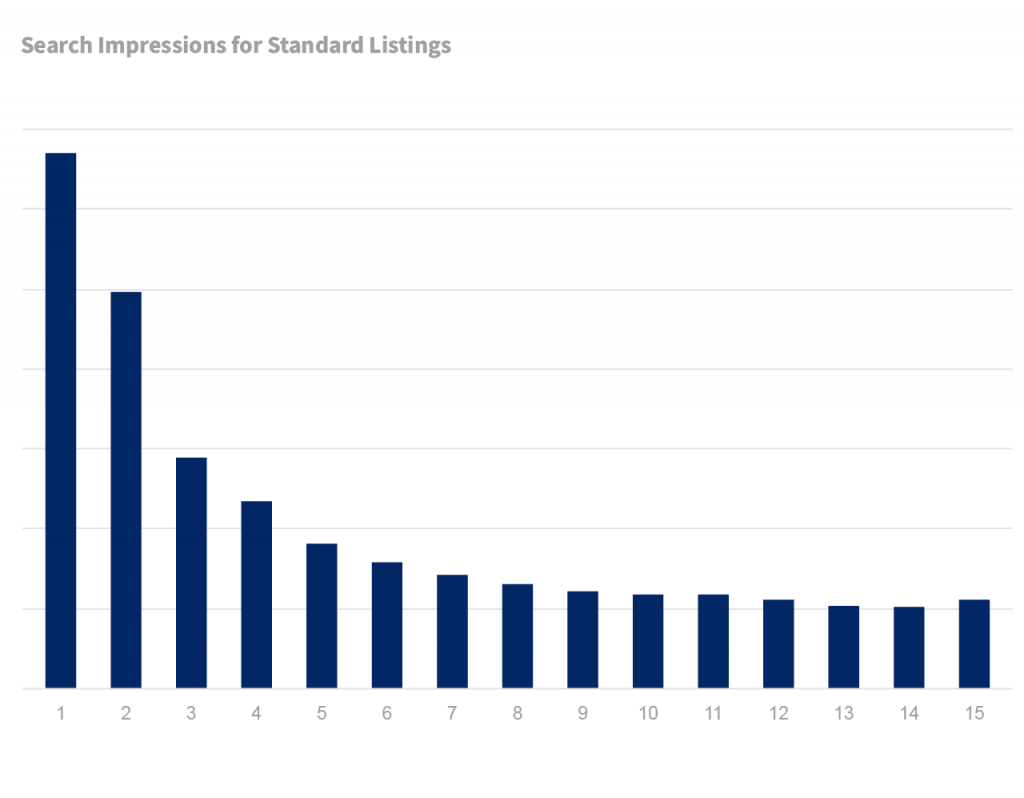
Life of a listing by search views
Just like any search engine, your listings over time will get less interest. Based on aggregate StreetEasy data, you can see how search views decrease significantly after the first few days.
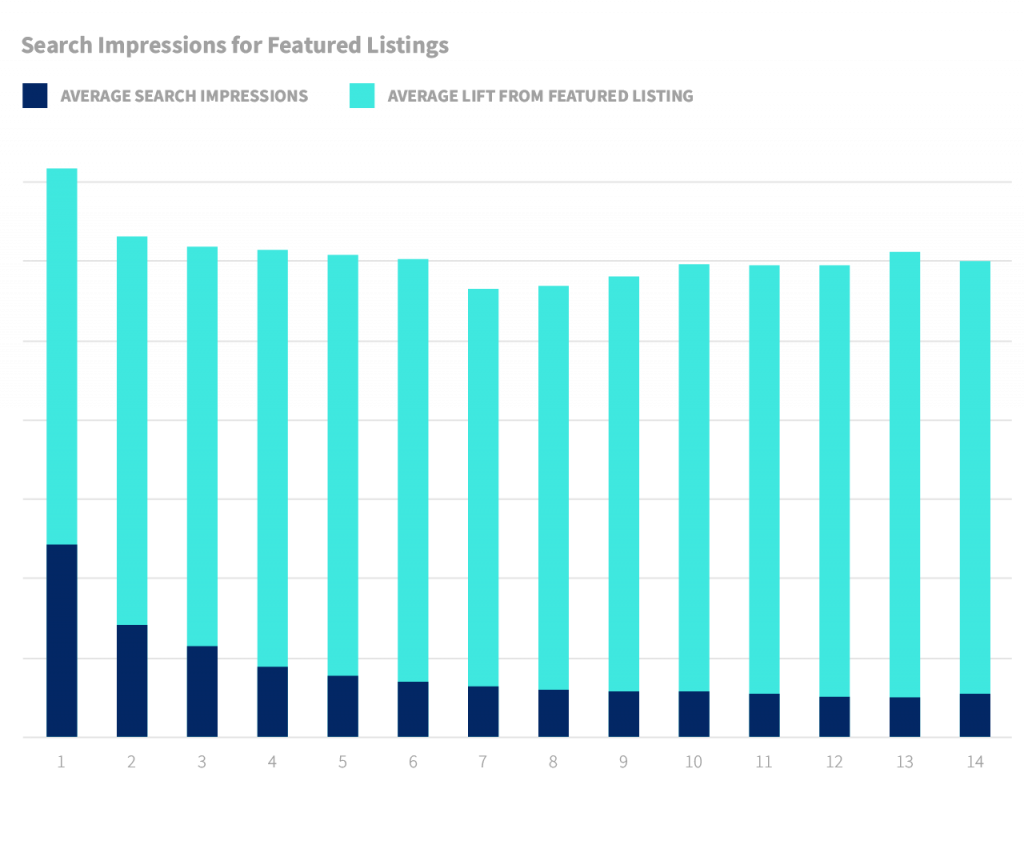
With Featured Listings, you can make sure your listing continues to be seen by people searching for apartments like yours. That happens because when you choose to feature a listing, you get put in a rotation in the top slots on search pages when buyers and renters search for apartments that match yours.
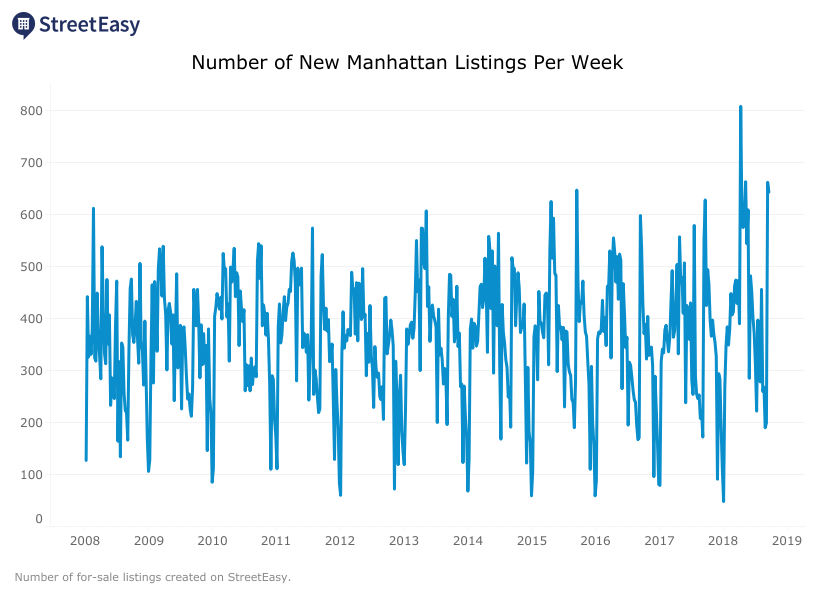
2018 brought two of the biggest weeks for new for-sale listings in StreetEasy history
Early this spring, we saw a huge spike in listings, and we expect fall will bring a flood of new listings, too. This wave of new for-sale listings will push inventory to highs not seen since the 2008 financial crisis, making it even harder for your listings to stand out.
All of this volume makes it important to be patient and wait for the right buyer or renter, but it also makes it extra crucial to use strategies like Featured Listings to stand out. The state of the current economy on a national and regional level means that people are still in the market to buy — you just need to make sure your apartment fits the neighborhood price expectations. Affordable units are still in high demand, too.
Listings by neighborhoods
These are the neighborhoods people are searching in the most:
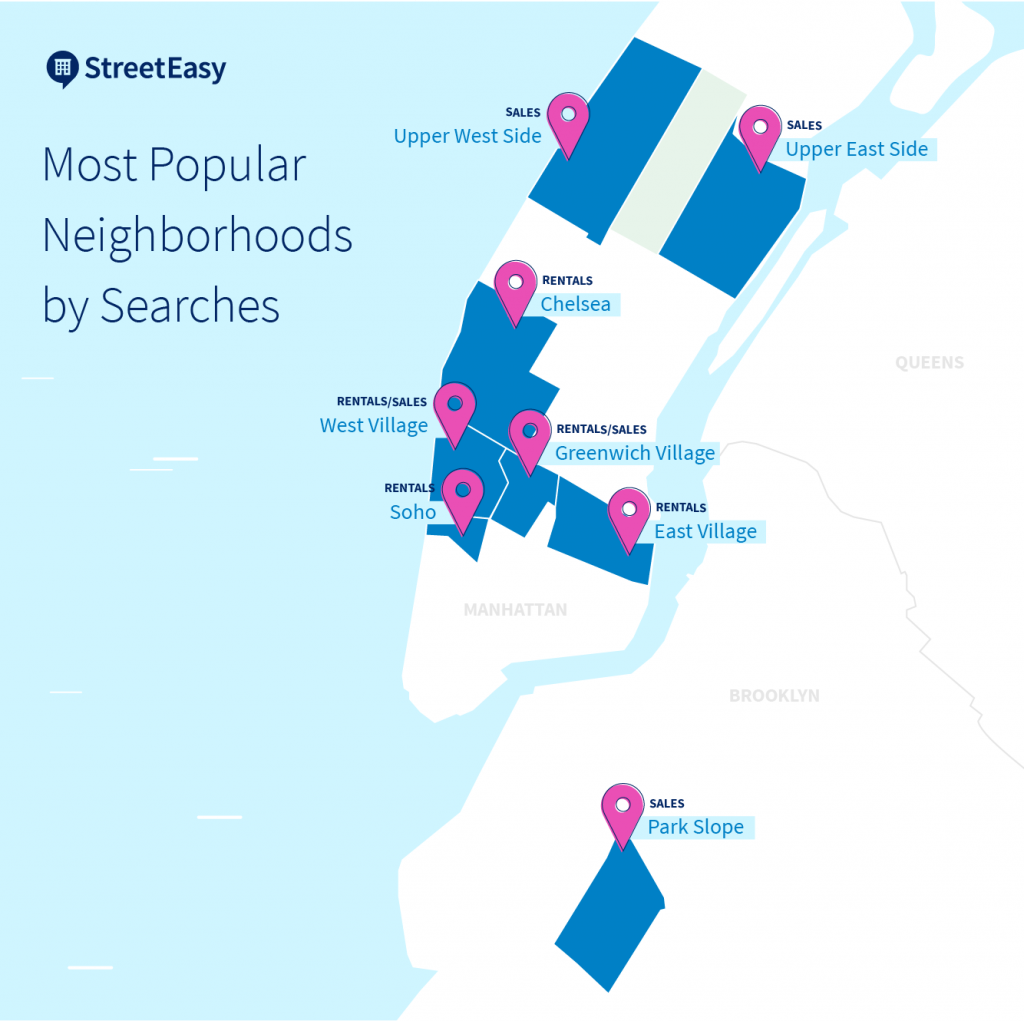
These are the most popular neighborhoods with the most listings:
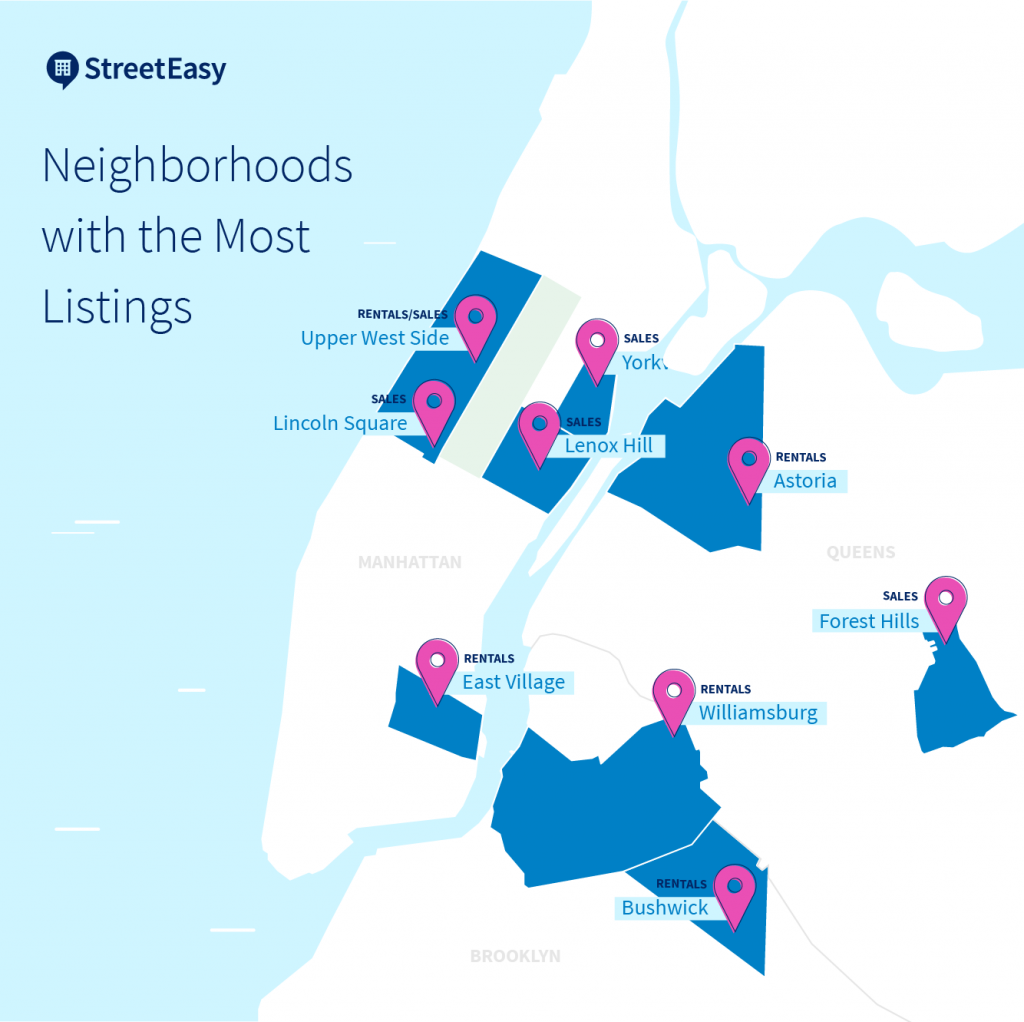
But that’s only a top-level look on the demand of NYC neighborhoods. We regularly dig deeper on the data, so be sure to check out Neighborhood Data page often to stay up-to-date on the whole city.’
There are more listings in spring and summer, and fewest in winter
As we mentioned, spring tends to see a spike in listings with a slight dropoff in winter. Here’s what that looks like split between sales and rental inventory.
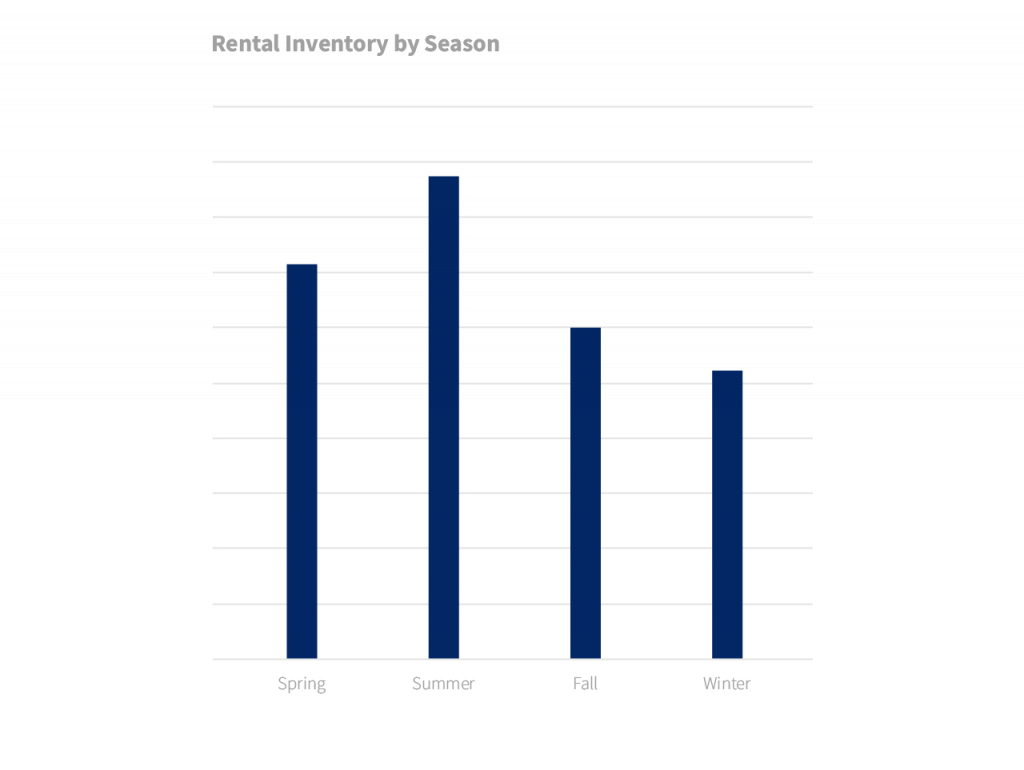
That inventory ultimately leads to buyers’ and renters’ markets during certain times of the year. In the summer, renters have a lot more choices (sometimes around 6,000 more units!), so they might be more apt to shop around. On the flip side, we tend to see an increase in discounts during winter months as a means to try to move units. Our data set shows that in October, there can be above a 20% increase in the number of listings that offer discounts. Inventory isn’t the whole story, and it’s all important to note when you’re taking on clients at different times of year.
Want more tips on how to give your listings a lift? Check out our guide to constructing the best listing, and be sure to brush up on your photo skills with an expert-fueled guide on listing photography.