

August 2025 Housing Market Report
Key Takeaways:
NYC Sales Market
- New York City saw strong annual increases in new sales contracts and new listings in August, indicating both buyers and sellers have been returning to the market as mortgage rates declined.
- Affordability has been improving in Manhattan, with the typical monthly mortgage burden falling 7.4% from a year ago due to new listings with lower asking prices.
- Brooklyn remained one of the most competitive boroughs for buyers, with homes sold in August receiving a median of nearly 100% of their last asking price.
NYC Rental Market
- Rental inventory decreased by 8.8% citywide compared to last year, as the busy summer rental season left fewer available homes for those aiming to move before fall.
- Despite recent declines, mortgage rates remain substantially above pre-pandemic levels, keeping buyers on the sidelines and limiting rental inventory growth in NYC.
- As the rental market heats up, most NYC neighborhoods saw higher median asking rents than a year ago, but eight neighborhoods saw declines as more affordable homes entered local markets.

NYC Sales Market
Across New York City, 1,889 homes entered contract in August, an 11.2% increase from a year prior. The strong annual growth in new sales contracts was complemented by a solid 6.7% rise in new listings. As sellers continue to rejoin the market, the NYC market remains balanced. Homes entering contract in August spent a median of 83 days on the market, just two days more than a year ago, indicating that buyers are in no rush.
The median asking price in NYC was $1M in August, roughly the same as a year ago, as motivated sellers continued to adopt more strategic pricing. In addition to the unchanged median asking price, declining mortgage rates this summer likely helped improve mortgage affordability. The expected monthly payment for an NYC buyer considering a median-priced home with a 20% down payment has been declining annually since March. In August, the monthly payment for this would-be buyer fell 2.9% to $5,103, likely allowing additional sidelined buyers to rejoin the market.
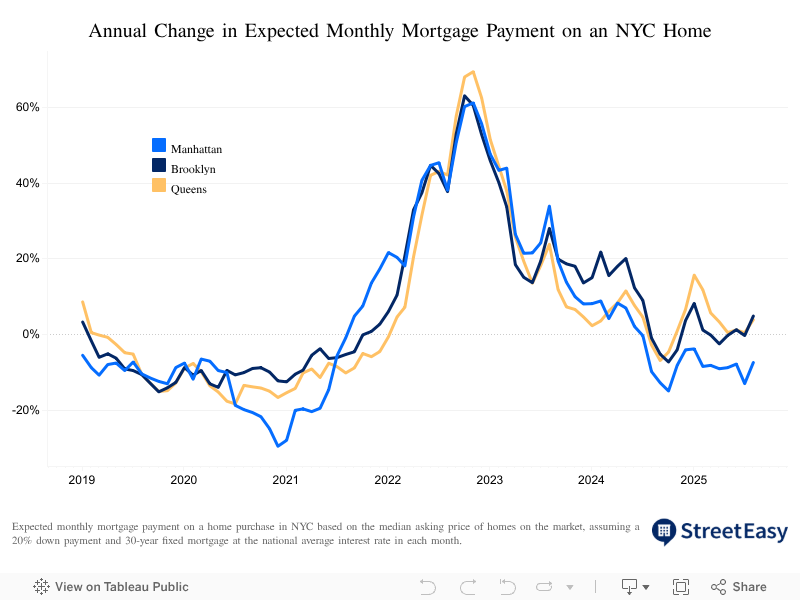
Sellers in Manhattan continued to enter the market with lower asking prices to accommodate patient buyers. As a result, the borough’s median asking price continued to decline after falling 5.1% in August from the previous year. Combined with recent declines in mortgage rates, the monthly payment for a would-be buyer dropped sharply by 7.4% to $7,139 from a year ago. This improving affordability is fueling sales: in August, 847 homes entered contract in Manhattan, up 9.9% from a year ago. Downtown and Midtown neighborhoods combined saw a 10.9% jump in new contracts, leading the borough in sales activity.
Meanwhile, across the East River, Brooklyn remained one of the most competitive boroughs for buyers. Homes sold in August received a median of 99.7% of their last asking price in Brooklyn, the highest since August 2022. The latest median ratio in Brooklyn is higher than 97.8% in Manhattan and 98.6% in Queens. One in three (33.5%) homes in Brooklyn sold above asking in August, well above 19.6% for the entire city. Moreover, a 6.1% increase in new contracts in August shows that demand for homes in Brooklyn endures, despite the borough’s rapidly rising median asking price. The median asking price in Brooklyn sits at $1.1M, up 7.6% from last year — the most significant gain of any borough in the city.
NYC Homes Under $1M on StreetEasy Article continues below


Queens also saw a significant rise in asking price in August — up 7.5% from a year ago to $690K. Queens saw a 21.5% jump in new contracts to 395 in August, the largest annual increase among the five boroughs. A 19.9% jump in co-op contracts drove the strong increase, with Forest Hills, Jackson Heights, and Rego Park topping the Queens co-op market in August with 45, 33, and 12 new contracts respectively. In particular, the 33 new contracts in Jackson Heights are nearly triple the volume last year, indicating a resurgence of co-op sales activity in the neighborhood.
Despite increased economic uncertainty, NYC buyers have shown eagerness to join the market after waiting on the sidelines in recent years. Meanwhile, strong buyer activity has been anchored by additional sellers rejoining the market. As long as mortgage rates follow their gradual downward trend, the city will continue to see high activity beyond Labor Day and pave the way for another busy fall shopping season this year.
NYC Rentals Under $3,000 on StreetEasy Article continues below


NYC Rental Market
The NYC rental market tightened this summer, as low inventory amid strong demand led to faster rent growth, especially in Manhattan. The citywide median asking rent was $4,080, up 7.4% from a year ago. Manhattan saw the largest increase, with a 9.6% jump in median asking rent to $4,722 — marking the 12th consecutive month of year-over-year rent increases.
In Brooklyn, the median asking rent rose 6.9% from a year ago to $3,850. Queens saw a 7.9% jump to $4,080 as the city’s low vacancy rate kept the pressure on the overall rental market. Just eight neighborhoods saw year-over-year declines in median asking rent in August as more affordable homes entered local markets.
NYC Neighborhoods With Largest Declines in Median Asking Rent, August 2025
| Neighborhood | Borough | Median Asking Rent | YoY Change | |
|---|---|---|---|---|
| 1 | DUMBO | Brooklyn | $5,600 | -8.2% |
| 2 | East New York | Brooklyn | $3,000 | -7.7% |
| 3 | Battery Park City | Manhattan | $5,524 | -5.6% |
| 4 | Midwood | Brooklyn | $2,683 | -4.2% |
| 5 | Jamaica | Queens | $2,963 | -2.9% |
| 6 | Mott Haven | Bronx | $3,137 | -1.4% |
| 7 | Roosevelt Island | Manhattan | $4,365 | -1.2% |
| 8 | Downtown Brooklyn | Brooklyn | $4,477 | -0.5% |
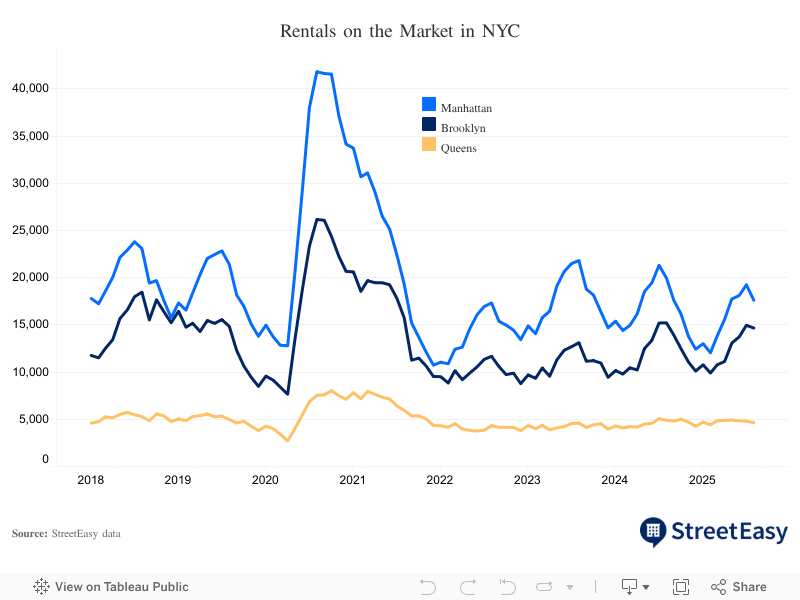
While NYC renters experienced relief from tough competition last summer as inventory surged across the city, the increases then did not last long as inventory started declining again in October last year. In August this year, 37,656 rentals were available across the city, down 8.8% from a year ago. While rental inventory was up significantly by 9.4% from August 2022, when the market was at its hottest, the city still has a large housing deficit to fill due to decades of undersupply.
Pressure remains on rental vacancy from the many would-be buyers who continue to be sidelined by affordability challenges in the sales market. As a result, Manhattan led the decline in citywide inventory, with a 12.8% drop in August. Brooklyn and Queens experienced declines of 4.6% and 5.5%, respectively, as the busy summer rental season left fewer available homes for those aiming to move before fall.
Despite recent declines in mortgage rates, rates remain significantly higher than pre-pandemic levels. With these buyers still on the sidelines, rental vacancy rates will likely remain low, limiting rental inventory growth in NYC. Against this backdrop, new developments likely hold the key to meaningfully reducing the housing deficit in NYC.
NYC Market Data: August 2025
Sales
 NYC |
 Manhattan |
 Brooklyn |
 Queens | |
|---|---|---|---|---|
| Median asking price | $1,000,000 (+0.1% YoY) | $1,400,000 (-5.1%) | $1,075,000 (+7.6%) | $689,358 (+7.5%) |
| Number of homes for sale | 15,512 (+10.3%) | 7,700 (+6.8%) | 3,837 (+9.8%) | 2,974 (+18.8%) |
| Homes entering contract | 1,889 (+11.2%) | 847 (+9.9%) | 522 (+6.1%) | 395 (+21.5%) |
| Median days on market | 83 (+2) | 101 (-1) | 73 (+3) | 70 (+1) |
Rentals
|
NYC |
Manhattan |
Brooklyn |
Queens | |
|---|---|---|---|---|
| Median asking rent | $4,080 (+7.4% YoY) | $4,722 (+9.6%) | $3,850 (+6.9%) | $3,383 (+7.9%) |
| Number of homes for rent | 37,656 (-8.8%) | 17,403 (-12.8%) | 14,517 (-4.6%) | 4,625 (-5.5%) |
| Share of rentals with price cuts | 17.6% (-1.6pp) | 21.3% (-1.5pp) | 15.2% (-2.3pp) | 13.6% (+0.5pp) |
| Share of rentals offering concessions* | 16.5% (+2.3pp) | 11.9% (-1.9pp) | 19.5% (+6.2pp) | 19.3% (+4.2pp) |
Thinking about buying in NYC? Chat with our complimentary, licensed Concierge to learn about the buying process.
StreetEasy is an assumed name of Zillow, Inc. which has a real estate brokerage license in all 50 states and D.C. See real estate licenses. StreetEasy Concierge team members are real estate licensees, however they are not your agents or providing real estate brokerage services on your behalf. StreetEasy does not intend to interfere with any agency agreement you may have with a real estate professional or solicit your business if you are already under contract to purchase or sell property.