Key Takeaways:
- Brooklyn and Queens are emerging as key rental markets, with slowing rent growth compared to Manhattan, where rent growth has been accelerating.
- Inventory is declining sharply in Manhattan as elevated mortgage rates keep would-be buyers in the borough’s rental market.
- Concessions are on the rise in neighborhoods with prevalent new developments, such as Windsor Terrace, Brooklyn, and Mott Haven, Bronx.
The median asking rent in New York City was $3,600 in December, 2.9% higher than a year ago but unchanged from November. Indicating a steady market, the current annual rate of rent growth is the same as a year ago.
Citywide rental inventory fell 2.3% from a year ago to 26,898 units in December after declining 4.8% in November. The back-to-back declines over the two months were the first since October 2022. Inventory continued to rise in Brooklyn, Queens, and the Bronx, but the increases were insufficient to offset another sharp decline in Manhattan. The supply of new rental developments in Manhattan has been more limited compared to the outer boroughs over recent years. Moreover, mortgage rates began rising again in October, keeping some would-be buyers in Manhattan in the rental market.
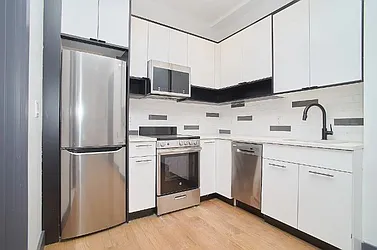
With low vacancy rates across the city, new construction has been a primary source of the current rental supply. The construction boom in the outer boroughs has led to modern buildings taking a larger share of the city’s overall inventory. In December, 26.2% of NYC’s rentals were in buildings built after 2010, compared to 21.9% in December 2023. Renters prioritizing certain amenities will likely find more options across New York’s rivers this year — one of our housing market predictions for 2025.
As more new developments entered the market, 22.1% of rentals across the city offered at least one month of free rent as concessions in December — the highest share since July 2021. In December 2023, 18.4% of the city’s rentals advertised concessions. As competition among renters continued to cool, landlords likely used concessions to attract renters rather than offering lower gross rents.
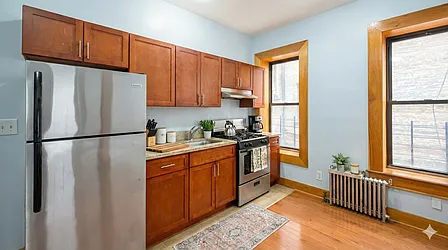
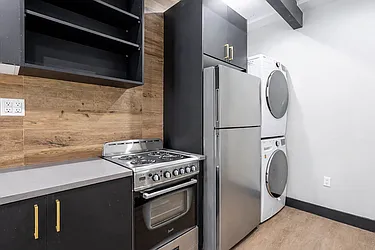
Manhattan Rentals Under $3,500 on StreetEasy Article continues below
As Inventory Shrank, Renters Saw Tougher-Than-Usual Competition in Manhattan
In December, there were 12,025 rentals in Manhattan, 13.4% below a year ago. Manhattan was the only borough to see a year-over-year decline in inventory. The Upper East Side and Upper West Side saw the sharpest declines in the borough, dropping 18.9% and 20.9%, respectively.
Rental inventory soared 16.2% to 960 units in the Bronx, the strongest increase in the city. Queens saw a 9.7% jump to 4,140 units. In Brooklyn, inventory rose 7.9% to 9,718 units. However, the increases in the outer boroughs weren’t enough to counter the sharp drop in Manhattan.
Though demand remained stable, declining inventory led to heated competition in Manhattan. An average rental listing in Manhattan received 13.9% more inquiries in December than a year ago. In the other boroughs, competition continued to cool as more new listings replenished inventory. Brooklyn and Queens, combined, surpassed Manhattan to become the city’s largest rental market in August. As new construction continues to add to the inventory in Brooklyn and Queens this year, the two boroughs will likely emerge as the bedrock of the city’s rental market.
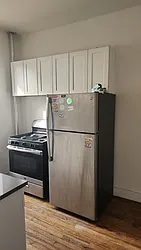
Brooklyn Rentals Under $3,000 on StreetEasy Article continues below
Rent Growth Is Slowing in Brooklyn and Queens
Renters looking for modern buildings and popular amenities, such as in-unit laundry and dishwashers — the two most-searched rental amenities on StreetEasy® last year — will increasingly weigh their options in Brooklyn and Queens, which often come at a lower price than Manhattan. In December, the median asking rent in Brooklyn and Queens was $3,395 and $3,000, respectively, significantly lower than $4,300 in Manhattan.
Rent growth has also slowed substantially in Brooklyn and Queens. According to the StreetEasy Rent Index, which tracks rental price trends over time by leveraging repeatedly rented properties, typical asking rents in Brooklyn rose 3.5% year-over-year in December, slower than 4.1% a year ago. In Queens, rent growth slowed to 3.7% from 4.5%. The two boroughs eclipsing Manhattan in rental inventory will help stabilize the city’s rental market this year.
By comparison, the StreetEasy Rent Index indicates accelerating rent growth in Manhattan. At 4.2% this December, the current growth rate is nearly double what it was a year ago (2.2%). Stronger rent growth in Manhattan is consistent with renter competition heating up in the borough.
Concessions Are Concentrated in Markets With More New Construction
Renters have more opportunities to score temporary reductions in housing costs through concessions in neighborhoods with more new developments. In December, concessions were most prevalent in Windsor Terrace, Brooklyn; Mott Haven, Bronx; and Jamaica, Queens. In Windsor Terrace, nearly two in three rentals offered concessions: the highest of any NYC neighborhood with at least 100 rental listings in December. In Mott Haven and Jamaica, as well as Midtown South and Battery Park City in Manhattan, more than half of all rental listings in December offered concessions.
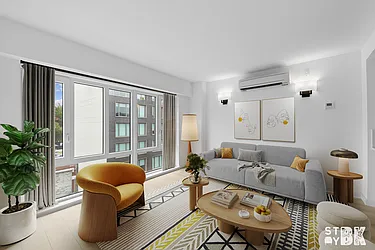
Queens Rentals Under $2,500 on StreetEasy Article continues below
Most of the neighborhoods with the highest shares of rentals offering concessions experienced surges in new development following targeted rezonings over the past decade and a half. In December, 58% of rentals in Windsor Terrace were in buildings constructed since 2010. A prominent example is One Park Point, with a portion of the building set aside for mixed-income, rent-stabilized apartments.
In Mott Haven, 95% of all rental listings in December were in newly constructed buildings. Following a series of rezonings, the neighborhood saw a surge in new development, providing thousands of market-rate units alongside rent-stabilized apartments in 2024.
Neighborhoods With Highest Shares of Rental Concessions
| Neighborhood | Borough | Share of Rentals With Concessions | Share of Rentals in Buildings Constructed Since 2010 | Median Net-Effective Rent* | |
|---|---|---|---|---|---|
| 1 | Windsor Terrace | Brooklyn | 64% | 58% | $3,311 |
| 2 | Mott Haven | Bronx | 59% | 95% | $2,669 |
| 3 | Jamaica | Queens | 56% | 90% | $2,475 |
| 4 | Midtown South | Manhattan | 53% | 34% | $4,697 |
| 5 | Battery Park City | Manhattan | 50% | 1% | $4,472 |
| 6 | Long Island City | Queens | 48% | 85% | $4,202 |
| 7 | Downtown Brooklyn | Brooklyn | 47% | 74% | $4,219 |
| 8 | DUMBO | Brooklyn | 42% | 79% | $6,120 |
| 9 | Financial District | Manhattan | 40% | 19% | $4,263 |
| 10 | Greenpoint | Brooklyn | 36% | 64% | $4,459 |
Source: StreetEasy data. Only neighborhoods with at least 100 listings in December were included in our analysis. *Net-effective rent distributes the discount from free months of rent across all other non-free months of a lease.
StreetEasy is an assumed name of Zillow, Inc. which has a real estate brokerage license in all 50 states and D.C. See real estate licenses. StreetEasy does not intend to interfere with any agency agreement you may have with a real estate professional or solicit your business if you are already under contract to purchase or sell property. All data for uncited sources in this presentation has been sourced from Zillow data. Copyright © 2025 by Zillow, Inc. and/or its affiliates. All rights reserved.


