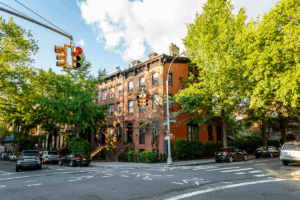
Homes in Manhattan and Brooklyn sell fast and the median days on market, our measure of how long a home stays on the market, has gotten progressively shorter over time.
According to the StreetEasy Q3 2015 Quarterly Market Report, homes in Manhattan that sold in the third quarter spent a median of 56 days on the market, while homes in Brooklyn spent a median of 54 days on the market. Although this is not the shortest time on record, it is quite fast from a historical perspective. The chart below shows how median days on market in Manhattan and Brooklyn have changed over the last four years by home type.
[tableau server=”public.tableausoftware.com” workbook=”SaleToListDaysOnMarket” view=”daysMarket” tabs=”no” toolbar=”no” revert=”” refresh=”yes” linktarget=”” width=”600px” height=”470px”][/tableau]
A shorter time on market is an indicator of stronger competition among buyers, most likely due to demand outpacing supply. This is certainly the case in Manhattan, where for-sale inventory declined by 23.8 percent in the four years between Q3 2011 and Q3 2015.
As the time on market falls, home sellers also tend to receive more of their initial asking price. We have found a strong negative correlation between time on market and sale-to-list price ratio, meaning the shorter the time on market, the higher the share of asking price a seller typically receives in the final sale of their home.
Take Prospect Park, for example. In the third quarter, homes there typically spent just 39 days on the market (the shortest period among all Brooklyn submarkets) yet the median sale-to-list price ratio was 102.3 percent, meaning the typical home sold for 2.3 percent above the initial asking price (the highest in the borough).
Below is a time series of the median sale-to-list price ratio in Manhattan and Brooklyn by home type.
[tableau server=”public.tableausoftware.com” workbook=”SaleToListDaysOnMarket” view=”saleList” tabs=”no” toolbar=”no” revert=”” refresh=”yes” linktarget=”” width=”600px” height=”470px”][/tableau]
For all types of housing, and in both boroughs, the median sale-to-list price ratio continues to converge around 100 percent. A ratio greater than 100 percent indicates that the final recorded sales price is more than the final recorded sales price. In other words, strong competition among buyers bids up the price beyond what the seller even asks.
In markets like Prospect Park with a median sale-to-list price ratio well above 100 percent, bidding wars are commonplace. Since 2009, the correlation between the median sale-to-list price ratio and median days on market for all homes in Brooklyn and Manhattan has been -0.85, which is a very strong relationship.
Over the last two years, however, we have seen the strong negative correlation fall to zero among Brooklyn condos and townhomes, suggesting that the Brooklyn townhouse and condo markets may be experiencing a slowdown.
One reason that a slowdown may be occurring is that inventory among condos and townhomes in Brooklyn has increased dramatically over the last two years (22 percent and 61 percent, respectively) while co-op inventory has declined by five percent. Condo and townhome prices have also grown at a slightly slower pace than co-ops. Using the StreetEasy Price Indices, we found that the median resale price of all co-op units in Brooklyn grew by 23 percent from Q3 2013, while the median resale price of all condos and townhomes grew by 20 percent and 17 percent, respectively.
The residential real estate market in Manhattan and Brooklyn is an increasingly competitive place for buyers. Across the market, median days on market for properties continue to decrease, while median sale-to-list price ratios rise. In the Brooklyn condo and townhouse markets, however, greater inventory and slowing price appreciation are signs that those markets may be in store for even slower growth in the near future.


