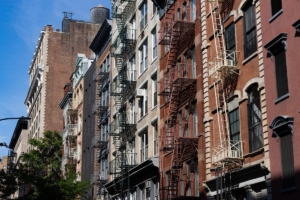
In February, the StreetEasy Manhattan Price Index dropped to its lowest level since July 2015. (Getty Images)
Many sellers across New York City cut prices on their homes this February as winter brought a chill to the sales market. In Manhattan, more than 1 in 10 homes had their prices cut, and inventory increased by 11.7 percent from last year. With inventory levels and the share of price cuts high across the borough, prices cooled, too. The StreetEasy Manhattan Price Index [i] dropped 4.3 percent to $1,119,183, its lowest level since July 2015.
Even with prices down and an abundance of inventory, buyers continued to hesitate to make deals. Manhattan homes spent a median of 117 days on the market — up 27 days year-over-year, and the highest level in seven years. This trend appeared in all areas and price points across the borough. Downtown Manhattan [ii] saw the largest increase in median days on market — up 31 from last year, to 117 days total.
“With a strong economy and home-shopping season right around the corner, plenty of New Yorkers are well-positioned to buy this spring. However, many are willing to walk away from deals that just aren’t financially attractive and continue renting instead — creating a market poised to punish sellers who don’t price their homes sensibly,” says StreetEasy Senior Economist Grant Long. “When the inevitable wave of new inventory hits the market this spring, interested buyers should expect to see an uptick in price cuts as the market forces ambitious sellers to accept reality.”
See below for additional sales and rental market trends across Manhattan, Brooklyn and Queens.
February 2019 Key Findings — Manhattan
- Home prices dropped boroughwide. The StreetEasy Manhattan Price Index fell 4.3 percent to $1,119,183. Prices dropped in all five submarkets, with the Upper West Side [iii] seeing the most significant decrease — down 4.4 percent to $1,106,947, its lowest level since June 2015.
- Homes took a month longer to sell. Manhattan homes spent a median of 117 days on the market — up 27 days year-over-year. In February, homes in the Upper East Side submarket spent the most time on market at 123 days — 25 days longer than last year.
- Sales inventory remained high. The total number of homes for sale in Manhattan increased 11.7 percent year-over-year. Inventory grew across the borough, with Upper Manhattan [iv] gaining the largest relative share of new inventory at 18.4 percent.
- Recorded sales declined. There were 2.2 percent fewer home sales [v] in February in the borough. Sales decreased in all five submarkets, led by Downtown Manhattan, where there were 7.9 percent fewer sales.
- More than 1 in 10 homes had their prices cut. Some 11 percent of homes in Manhattan saw a price cut in February — a slight increase of 0.1 percentage points year-over-year. Upper Manhattan saw the most significant annual jump in the share of price cuts — up 1.3 percentage points to 10.3 percent.
- Rents continued to rise. The StreetEasy Manhattan Rent Index [vi] increased 2.5 percent annually, reaching $3,209. Downtown Manhattan rents reached their highest level ever — up 2.5 percent to $3,730.
February 2019 Key Findings — Brooklyn
- Prices remained the same. The StreetEasy Brooklyn Price Index increased by just 0.6 percent to $713,513. Prices rose across the borough, except in East Brooklyn [vii], where they dropped 3.1 percent to $615,464.
- Sales inventory increased significantly. Inventory in Brooklyn rose 21.9 percent from last year. There were some 150 more homes available for sale in Northwest Brooklyn [viii] this February than last year — a 27.9 percent increase.
- Homes took two weeks longer to sell. The median days on market increased to 90 days in Brooklyn, up 15 days from last year. Homes in Prospect Park [ix] spent over two months longer on the market — up 70 days to 101 total days.
- There were more price cuts. Boroughwide, the share of price cuts increased by 4.2 percentage points to 11.6 percent. East Brooklyn had the largest spike in price cuts compared to last year — up 5.7 percentage points to 11.8 percent.
- Rents in North Brooklyn decreased slightly. Despite the cancellation of the L train shutdown, rents in North Brooklyn [x] remained relatively stagnant at $3,046 — a 0.9 percent decrease from last year. Boroughwide, the StreetEasy Brooklyn Rent Index was up 1.8 percent to $2,593.
- One in 10 rentals advertised concessions. The share of rentals advertising concessions dropped by 7.1 percentage points year-over-year, down to 9.7 percent boroughwide.
February 2019 Key Findings — Queens
- Price growth continued to slow. The StreetEasy Queens Price Index increased 4.0 percent annually, reaching $523,592. While prices are still increasing in the borough, growth has slowed compared to the high levels seen in 2018.
- Sales inventory increased the most of any borough. Queens saw the most significant jump in sales inventory of the three boroughs tracked — up 26.5 percent year-over-year.
- Homes sold the fastest. Of the three boroughs, homes in Queens moved off the market the fastest at a median of 67 days — one day faster than last year.
- The share of price cuts increased. The share of homes with a price cut increased to 8.8 percent in the borough, up 3.1 percentage points year-over-year.
- Rents increased steadily. The StreetEasy Queens Rent Index reached $2,163, up 2.4 percent year-over-year. Northwest Queens had the largest increase in rents, up 2.3 percent to $2,254.
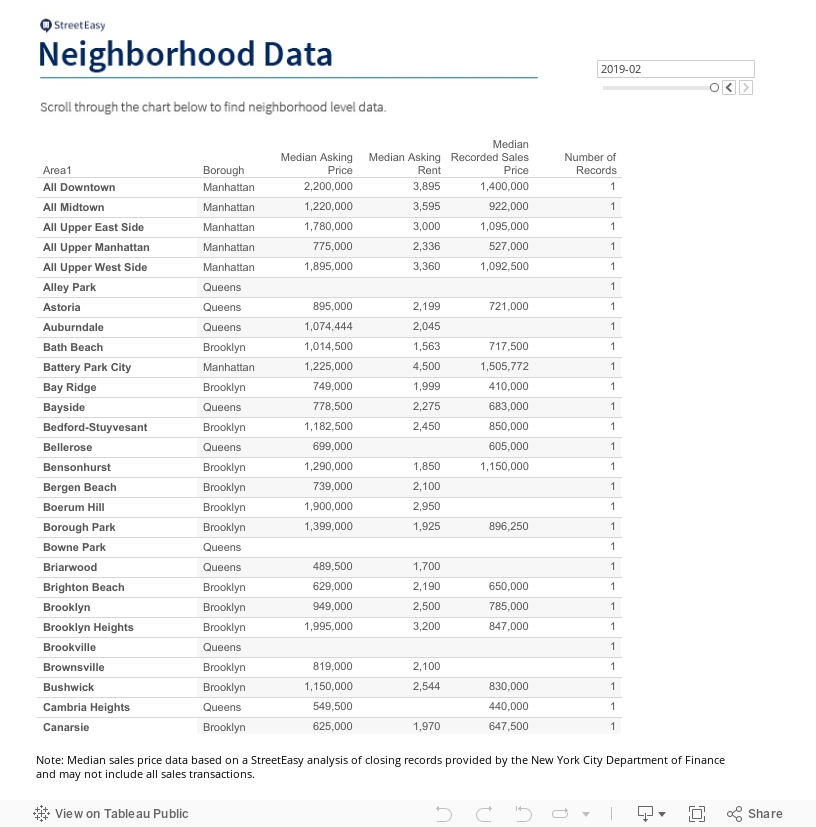
The complete StreetEasy Market Reports for Manhattan, Brooklyn and Queens, with additional neighborhood data and graphics, can be viewed here. Definitions of StreetEasy’s metrics and monthly data from each report are available here.
—
[i] The StreetEasy Price Indices track changes in resale prices of condo, co-op, and townhouse units. Each index uses a repeat-sales method of comparing the sales prices of the same properties since January 1995 in Manhattan and January 2007 in Brooklyn and Queens. Given this methodology, each index accurately captures the change in home prices by controlling for the varying composition of homes sold in a given month. Levels of the StreetEasy Price Indices reflect average values of homes on the market. Data on the sale of homes is sourced from the New York City Department of Finance. Full methodology here.
[ii] The Downtown Manhattan submarket includes Civic Center, Financial District, Tribeca, Stuyvesant Town/PCV, SoHo, Little Italy, Lower East Side, Chinatown, Battery Park City, Gramercy Park, Chelsea, Greenwich Village, East Village, West Village, Flatiron and Nolita.
[iii] The Upper West Side submarket includes Lincoln Square, Upper West Side, Manhattan Valley and Morningside Heights.
[iv] The Upper Manhattan submarket includes Hudson Heights, Hamilton Heights, Washington Heights, Inwood, Fort George, West Harlem, Central Harlem, East Harlem, Manhattanville, South Harlem and Marble Hill.
[v] Recorded sales are projected for the period based upon 1) data received from the New York City Department of Finance through the final day of the period, and 2) historical seasonal trends.
[vi] The StreetEasy Rent Indices are monthly indices that track changes in rent for all housing types, and are currently available from January 2007 in Manhattan, January 2010 in Brooklyn, and January 2012 in Queens. Each index uses a repeat-sales method similar to that used to calculate the StreetEasy Price Indices. The repeat method evaluates rental price growth based on homes in a given geography that have listed for rent more than once. More details on methodology here.
[vii] The East Brooklyn submarket includes Bedford-Stuyvesant, Bushwick, East New York, Crown Heights and Brownsville.
[viii] The Northwest Brooklyn submarket includes Downtown Brooklyn, Fort Greene, Brooklyn Heights, Boerum Hill, Dumbo, Red Hook, Gowanus, Carroll Gardens, Cobble Hill, Columbia St. Waterfront District and Clinton Hill.
[ix] The Prospect Park submarket includes Park Slope, Windsor Terrace, Prospect Heights, Prospect Lefferts Gardens and Prospect Park South.
[x] The North Brooklyn submarket includes Greenpoint, Williamsburg and East Williamsburg.
—
Send your NYC real estate stories and tips to StreetEasy editors at tips@streeteasy.com. You will remain anonymous. And hey, why not like StreetEasy on Facebook and follow @streeteasy on Instagram?