

While your clients may easily find listings they like on StreetEasy, they need your help in determining value and using negotiation strategies. That’s why staying on top of market trends and getting granular with neighborhood data is key to the success of any agent worth their salt.
Now with the updated StreetEasy Data Dashboard, agents in New York City have new and improved access to StreetEasy’s most powerful data sets. It’s entirely comprehensive and it’s entirely free to use.
At StreetEasy, we firmly believe all good conversations about New York City real estate start with data, so we’re excited to share this enhanced tool with you.
Click here to access the StreetEasy Data Dashboard for free
1. Access Essential Metrics
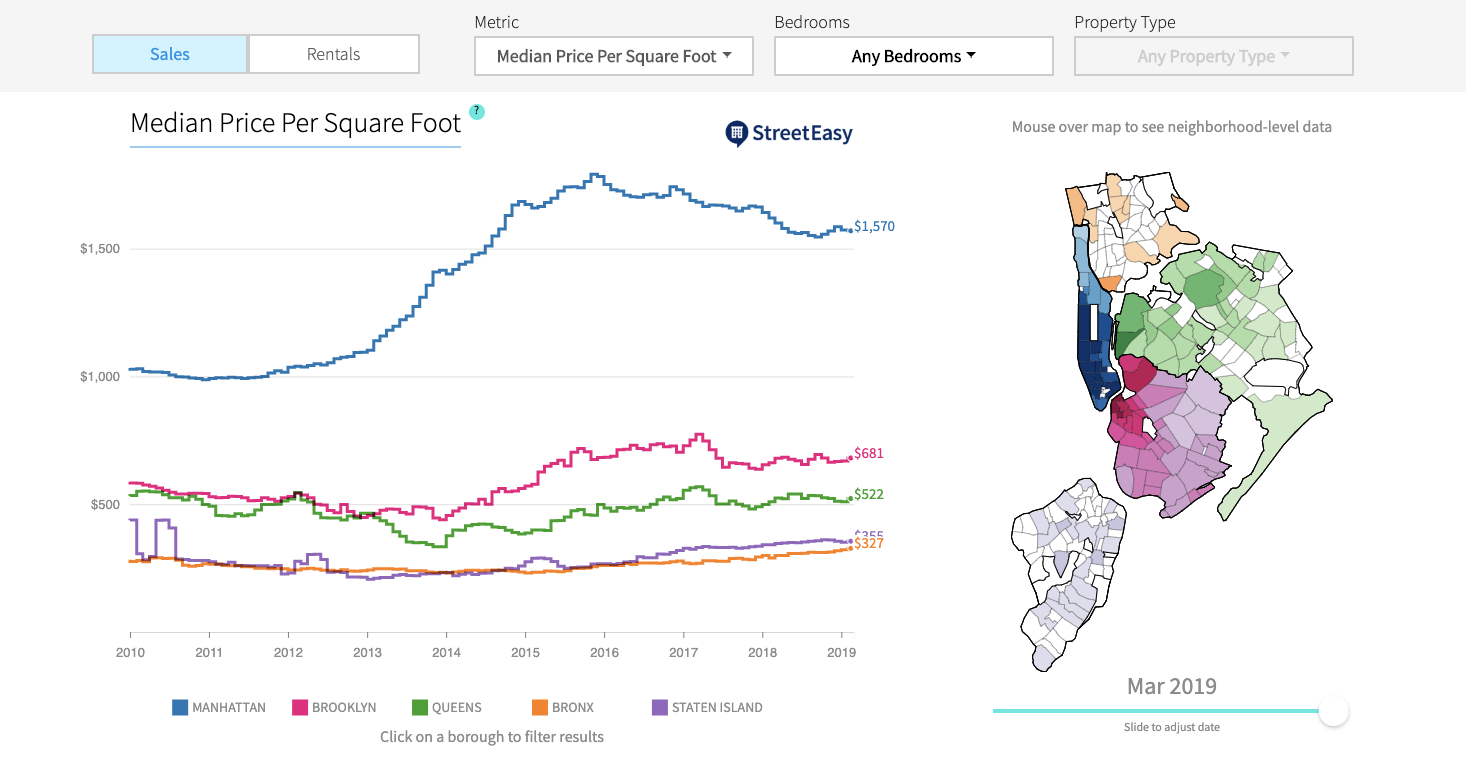
Using the StreetEasy Data Dashboard, you can now speak more confidently to your clients about key market metrics and further your own industry knowledge. You can access comprehensive data points including median price per square foot, median days on market, median recorded price, total new sales inventory, total recorded sales, and the sale-price-to-list-price ratio. To see how each of these metrics is defined, hover over the “?” in the tool.
2. Customize the Data
Once your clients have a better understanding of the local real estate market, they might have a specific neighborhood or property type in mind. The new StreetEasy Data Dashboard lets you customize the data by filtering on things like number of bedrooms and property type. With this information, you can give your clients recommendations custom-tailored to their needs. This service enhances your professional value and market knowledge.
3. Compare Any Neighborhood and Borough
As you know all too well, clients often have more than one neighborhood in mind. They want to buy in the West Village and are also curious about the Upper West Side. Chances are their budget better aligns with a different neighborhood entirely. It falls to you to educate and explain these neighborhood nuances to them. With the StreetEasy Data Dashboard, you can now compare any neighborhood and borough.
For example, suppose you want to learn how much higher the median sales price is in the West Village compared to Downtown Brooklyn? With our new modular chart section, you can view any combination of neighborhoods and/or boroughs with any sales or rental metrics — up to five areas and five metrics at once. If you want a more detailed view, select fewer metrics and areas to see larger charts.
4. Track the Market From Any Device
We know you are on the go, so we’ve optimized the StreetEasy Data Dashboard for iOS and Android on both mobile and tablet. You can now use this tool from any device. Just note that certain features, such as the modular chart section, are only available on tablet and desktop.
5. Download All the Data for Free
We understand it’s important for you to have complete control of the data so you can create custom analyses and own each and every conversation with your clients. With the new StreetEasy Data Dashboard, we’ve made all the underlying data available to download for free. Just scroll down to the bottom of the page and select which metrics you’d like to download.
We will keep updating the StreetEasy Data Dashboard to provide even more metrics, filters, views and downloadable data in the coming weeks. Keep checking back for the latest changes, and let us know if you have any ideas for how we can make the tool even better. You can reach us at agentsuccess@streeteasy.com.