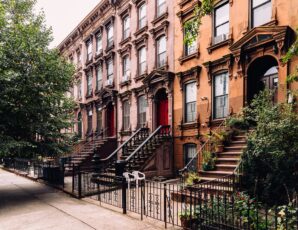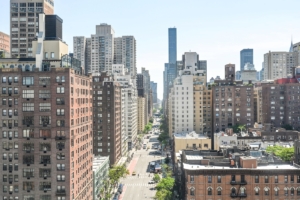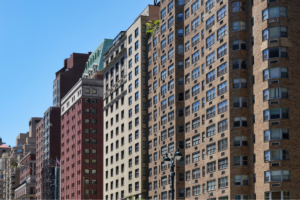
Despite Manhattan showing strong growth in real estate prices in 2015, one segment of the market continues to falter: luxury listings. According to the StreetEasy Price Index, the median resale price in Manhattan grew 7.1 percent to $1,002,008 at the close of the year. Among the most expensive homes in Manhattan (those priced above $2.3 million), however, the median resale price grew by just 0.3 percent at the close of the year. After peaking in May 2015 at a median price of $3.27 million, Manhattan’s luxury tier experienced seven consecutive months of price decline. By December 2015, the median price fell 0.3 percent to $3.26 million.
A telling example of the recent slowdown among Manhattan’s luxury market can be found at 15 Central Park West, the venerable luxury building designed by Robert A.M. Stern. In May 2014, one unit sold for $48 million. Just 18 months later, the same unit sold for $45 million – a $3 million loss.
Non-Luxury Homes in Manhattan See Strong Appreciation
While the luxury market in Manhattan has begun to waiver, moderately priced homes (between roughly $525,000 and $1.3 million) have experienced strong price appreciation recently as buyers chase a dwindling amount of supply on the market. The median resale price for homes in the second and third tiers grew 6.9 percent and 7.0 percent in the last year, respectively. These tiers account for homes priced between $525,000 and $795,00 and $795,000 and $1.3 million, respectively.
Looking at the five-year price appreciation of all home types, luxury properties have also underperformed compared to their lower priced counterparts. Across Manhattan, the median resale price for all homes increased 33.7 percent between 2010 and 2015, according to the StreetEasy Price Index. The median resale price of luxury homes, however, increased 31.3 percent in the same period. Homes priced in the fourth tier just below the luxury tier (homes priced between $1.45 million and $2.5 million) enjoyed the highest appreciation, jumping 36.8 percent between 2010 and 2015.
Brooklyn Luxury Shows Early Signs of Slowing
In Brooklyn, the luxury market is experiencing a similar though less pronounced slowdown recently. In December, the median resale price of luxury homes (those priced above $972,000) fell ever-so-slightly (0.02 percent) from November to $1.34 million and closed the year 4.2 percent higher than last year. Prior to the December monthly dip, the luxury market saw five consecutive months of declining monthly growth, indicating that the top end of the market is losing some steam. Indeed, the luxury market grew at just half the pace of all Brooklyn homes. The median resale price of all homes in Brooklyn rose 8.3 percent in 2015 to $537,193 in December.
Unlike Manhattan, luxury homes in Brooklyn have seen the most appreciation in the last five years. Between 2010 and 2015, the median resale value in the top tier increased by 52.6 percent, the highest growth among the five price tiers. In fact, the higher the price tier in Brooklyn, the greater the five-year price appreciation in Brooklyn.
Use the graph below to explore the historical price performance of each tier within Manhattan and Brooklyn:
[tableau server=”public.tableau.com” workbook=”priceIndexQuintiles” view=”quintileWindow” tabs=”no” toolbar=”no” revert=”” refresh=”yes” linktarget=”” width=”600px” height=”1170px”][/tableau]
How We Did It
In this analysis, the StreetEasy Price Indices are divided into quintiles. The Price Indices are a repeat sales regression model, which means that any property that has been bought and sold at least twice can be included in the index. This repeat sales method means that the change in price over time is a like-to-like comparison. A comparison of median prices over time is not a like-to-like comparison, because the median uses a changing set of properties that have sold. In a previous blog post, we outline this inventory mix problem behind comparing median sale prices across time.
Splitting the indices up into quintiles by price required assigning each property with at least two transactions to a quintile group. To determine the price cut-offs, we looked at all recorded sales using New York City Department of Finance data and for each year, and then split the transaction distribution into quintiles. If 20 percent of the transactions of a given year were below a particular recorded sale, that price would be the cut-off for the bottom quintile for that year. If eighty percent of the transactions of that same year were below a particular recorded sale, that price would be the cut-off for the top quintile. Returning to the set of properties with at least two transactions, using the date of the first transaction and the price cut-offs that corresponded to the year of that first transaction, the transaction was assigned to a quintile according to which price group it fell into. That transaction would then be included in the index according to its assigned quintile.
If a property had more than two transactions, we allow subsequent transactions to be reassigned to other quintiles, if necessary. This ensures that changes in the property and its area are reflected in the appropriate index. This process also allowed us to better identify and screen out transactions that were not arm’s length sales, such as when one of the sellers is also a buyer. These changes affect both the shape and level of the indices.