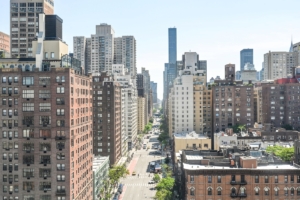
The fall season yielded little relief for renters in Manhattan, where rent growth outpaced resale price growth in November, according to StreetEasy’s November 2016 Market Reports.
Manhattan Rents Outpace Sales Price Growth
- Manhattan’s median monthly rent grew 1.9 percent year-over-year to $3,245.
- Median resale price in Manhattan rose 0.5 percent year-over-year to $979,791, the slowest pace of price growth since January 2011.
- Brooklyn’s median rent increased 0.9 percent year-over-year to $2,870.
- Brooklyn’s median resale price grew 3.6 percent year-over-year to $562,663, the slowest pace of price growth since September 2012.
[tableau server=”public.tableau.com” workbook=”priceIndices” view=”StreetEasyPriceIndex” tabs=”no” toolbar=”no” revert=”” refresh=”yes” linktarget=”” width=”600px” height=”820px”][/tableau]
Upper Manhattan Was Hot in November
The Upper Manhattan submarket – comprised of Harlem, Inwood, Washington Heights, Hamilton Heights and Manhattanville – remained the least expensive submarket in Manhattan, but had the highest rent increases and fewest rentals discounted in November.
- Median monthly rent in the Upper Manhattan submarket remained the least expensive in the borough, but increased the most, rising 6.4 percent year-over-year to $2,449.
- Rents grew the least in the Upper East Side submarket, up 0.4 percent year-over-year to $2,714.
- Renters shopping in Upper Manhattan neighborhoods were least likely to see units discounted – less than a third of rental inventory in the area was discounted in November (29.9 percent). This was the lowest share of rental discounts among Manhattan submarkets.
- The Downtown submarket had the most discounts at a share of 47.3 percent, followed by the Upper West Side submarket (47.2 percent).
[tableau server=”public.tableau.com” workbook=”priceindexchangeYoY_v2″ view=”priceYoYchange” tabs=”no” toolbar=”no” revert=”” refresh=”yes” linktarget=”” width=”600px” height=”720px”][/tableau]
North Brooklyn Rents Fall in November
North Brooklyn, which is comprised of Williamsburg, East Williamsburg and Greenpoint, remained the most expensive submarket in Brooklyn, but was the only submarket in either borough where both rents and resale price declined.
- The North Brooklyn submarket remained the most expensive in Brooklyn, but was the only submarket in either borough where rents declined. Median rent fell 1.9 percent year-over-year to $3,079 in November.
- Median monthly rent in the South Brooklyn submarket remained the least expensive in the borough, but rose 4.3 percent year-over-year to $1,709.
- Fewer rentals received discounts in Brooklyn than Manhattan – 41.7 percent of Brooklyn rental inventory discounted in November. Nearly half of all rental listings in North Brooklyn (48 percent) were discounted last month, followed by Northwest Brooklyn (46 percent). South Brooklyn had the smallest share of rental inventory discounted (30.8 percent).
[tableau server=”public.tableau.com” workbook=”NovemberMarketOverview” view=”NeighborhoodData” tabs=”no” toolbar=”no” revert=”” refresh=”yes” linktarget=”” width=”600px” height=”870px”][/tableau]