Key Takeaways:
- Improving inventory in the resale market, in addition to continued economic and geopolitical uncertainties, will lead to cooling demand for sponsor condos in New York City.
- Despite the slowdown in the New York City sponsor condo market, Manhattan saw an increase in new contracts led by the luxury segment.
- As overall renter demand gradually cools, the citywide median net-effective rent declined 3.1% year-over-year to $4,885.
- The Manhattan amenity-rich rental market remains the most competitive, with neighborhoods close to Midtown and its office districts seeing more resilient demand.
- The rebalancing of the amenity-rich rental market has been uneven across the city, with Brooklyn outperforming the rest of the market.
The NYC Sponsor Condo Market Is Rebalancing
Across New York City, 641 sponsor condo units on StreetEasy® entered contract in Q2 2024 — 4.6% fewer than a year ago. The slowdown in sponsor condo sales activity reflects challenging market conditions.
Tight inventory has been keeping the sponsor market in balance, but buyers now have more options in the resale market compared to last year, with rising new listings as homeowners adjust to elevated mortgage rates. Those who can afford the current market have also become more patient and unwilling to overspend, due to high mortgage rates and continued economic and geopolitical uncertainties.
In Brooklyn and Queens, fewer sponsor condo contracts were signed in Q2 than a year ago. The number of new contracts fell 2.0% year-over-year to 247 in Brooklyn as declining inventory limited buyers’ options. In Queens, 96 sponsor condos entered contract, a decline of 2.7% from the year before.
In Manhattan, 297 sponsor condos entered contract, a 3.5% increase from a year ago. The increase was mostly driven by luxury sponsor listings with asking prices above $4.4M — the starting price of the most expensive 10% of the city’s broader sales market in Q2. Above this price point, 80 sponsor units entered contract in Manhattan, 11 more than a year ago. Excluding this segment, the number of new contracts in Q2 was essentially unchanged from a year ago.
That said, “luxury” can look different in Manhattan’s high-end market. The starting price of the top 10% of the borough’s sponsor condo market was nearly $10M in Q2. Above this price point, 18 sponsor units entered contract in Q2 in Manhattan, seven more than a year ago. However, the slight rise in luxury sponsor contracts does not appear sustainable, amid rising policy uncertainty ahead of the US presidential election in November.
Looking ahead, the gap between sale price and initial asking price, currently at 97%, will likely widen further this year as competition cools in the overall sponsor condo market. Meanwhile, slowing rates of inflation and wage growth will likely bring the Federal Reserve closer to cutting interest rates, and mortgage rates could decline further this year. A sustained improvement in housing affordability could help sidelined buyers gradually return to the housing market.
New Developments Drove Amenity-Rich Rental Inventory Growth in Outer Boroughs
There were 76,352 rentals on the NYC market in Q2 2024, up 3.9% year-over-year. The number of amenity-rich rentals is rising more quickly than the rest of the rental market, soaring 14.2% year-over-year to 11,739 units in Q2. We define “amenity-rich” rentals as those that offer in-unit laundry, a dishwasher, an elevator, and a doorman — the top four must-have amenities in NYC, based on StreetEasy search data — as well as a fitness center or pool in the building.
Amenity-rich rental inventory has increased sharply in recent years outside Manhattan. Following a series of rezonings, a construction boom in waterfront neighborhoods in the Bronx, Brooklyn, and Queens has led to an increase in amenity-rich inventory. There were 3,693 amenity-rich listings in Brooklyn, a 48.8% jump from a year ago. In Queens, there were 1,698 amenity-rich rentals on the market, an increase of 29.8%. By contrast, the number of amenity-rich listings in Manhattan fell 5.8% year-over-year to 5,882.

The Bronx saw 461 amenity-rich units in Q2, a 91% jump from a year ago. Nearly nine in 10 amenity-rich listings in the Bronx were in Mott Haven, where inventory has soared 93.7% since Q2 of last year. Inventory of market-rate and income-restricted affordable units in the borough has been rising following a series of targeted rezonings over the past two decades. The Bronx saw 9,842 new housing units in 2023, and among these new homes, 5,335 were affordable income-restricted rental units serving low- to middle-income households — more than any other borough in NYC.
Manhattan remains the largest amenity-rich rental market in the city, accounting for half of all amenity-rich rentals on the market in Q2. However, the borough has been struggling to increase its supply of new housing. In 2023, 3,746 new homes were built in Manhattan, about a third of the total in the Bronx. High construction costs and outdated zoning districts make it difficult to create additional housing in Manhattan. As a result, low vacancy rates in rental buildings have been limiting the number of units joining the borough’s market.
Rebalancing of Amenity-Rich Rental Market Has Been Uneven Across the City
In addition to rising inventory, elevated rents and high upfront costs have made it more challenging to afford a rental in NYC. New Yorkers earning the city’s average annual wage could afford less than 5% of rentals in 2023. Even tech workers, whose wages are higher than average, could afford about one in three rentals in the city.
As a result, competition for rentals has been cooling. The median asking rent of amenity-rich rentals in NYC fell 4.8% year-over-year to $4,998 in Q2 2024. The median net-effective rent — a calculation that distributes the discount from free months of rent across all other non-free months of a lease — decreased 3.1% to $4,885.
However, the rebalancing of the city’s amenity-rich rental market has been uneven across the five boroughs. The Manhattan market is in a holding pattern, with the median net-effective rent rising only 0.8% year-over-year to $6,000 in Q2.
The rental market in Brooklyn, however, is outperforming the rest of the city. Despite the recent rise in inventory, the average amenity-rich rental listing in Brooklyn received 20.7% more inquiries than its counterpart in Manhattan this year. Against this backdrop, the median net-effective rent for amenity-rich rentals in Brooklyn rose 1.3% year-over-year to $4,250 in Q2.
While competition among renters eased in Queens amid affordability concerns, lower price points compared to Manhattan have been supporting resilient renter demand. The average amenity-rich listing in Queens received 9.0% more inquiries than its counterpart in Manhattan this year. The median net-effective rent for amenity-rich rentals in Queens was stable at $3,846 in Q2, down just 0.1% year-over-year.
Following the recent surge of new developments in the Bronx, the borough’s median net-effective rent for amenity-rich rentals sank 6.4% year-over-year to $3,070. The Bronx saw less severe competition among renters this year, with the average amenity-rich listing receiving 10.5% fewer inquiries than its counterpart in Manhattan.
Two-Bedroom Rentals Have Become the Odd One Out
The decline in the citywide median net-effective rent for amenity-rich rentals appears more concentrated in units with two bedrooms. The median net-effective rent for two-bedroom amenity-rich rentals fell 3.7% year-over-year to $6,500 in Q2, while rents for other numbers of bedrooms have been more stable. By comparison, the median net-effective rent for studios slipped just 0.4% year-over-year to $3,680.
As more new developments join the market, inventory of one- and two-bedroom apartments has increased sharply. Across NYC, 4,805 one-bedroom and 3,552 two-bedroom amenity-rich units were on the market in Q2, up 12.8% and 16.0% year-over-year, respectively. By comparison, there were 2,240 studios and 1,142 rentals with three or more bedrooms on the market — far fewer than one- and two-bedroom units.
However, the average inquiries each listing receives indicates studios and one-bedroom apartments remain most popular among renters looking for amenity-rich buildings. Compared to two-bedroom amenity-rich rentals, the average studio and one-bedroom units received 13.3% and 15.6% more inquiries this year, respectively.
Manhattan’s Amenity-Rich Rental Market Remains Stable
Although hiring in industries such as tech and finance has slowed since the summer of 2022, low vacancy rates in Manhattan likely helped balance the softer demand. The median net-effective rent of amenity-rich rentals in the borough rose slightly by 0.8% year-over-year to $6,000 in Q2. The share of listings offering concessions declined to 24.1% from 32.0% a year ago.
In Q2 2024, six out of the top 10 most competitive NYC neighborhoods for amenity-rich rentals were in Manhattan. These neighborhoods saw stronger year-over-year increases in net-effective rents, and had low shares of rental listings offering concessions or price cuts.
The Upper East Side remained the most competitive neighborhood, with just 9.5% of rentals offering concessions — far lower than the borough-wide share of 26.7%. Amenity-rich rentals in this neighborhood tend to be more expensive, with a median net-effective rent of $8,750 — 45.8% higher than the borough median. The continued growth in net-effective rent and steady shares of concessions from last year underscore the resilient demand for luxury rentals, as wealthy New Yorkers increasingly consider renting over buying. Defined as the most expensive 10% of rental listings, the starting price point of the luxury rental market was $8,850 in Q2.
Demand has been more resilient in areas close to Midtown and its office districts, with fewer apartments offering concessions than in Downtown neighborhoods. The Flatiron District ranked second on our list in Q2, unchanged from our list in Q4 of last year, with 8.3% of its amenity-rich listings offering concessions. In Q2, 18.5% of rentals in the neighborhood reduced their asking rents, compared to 19.7% across the borough and 21.3% across all Downtown neighborhoods.
Fourth on our list, the Lower East Side is one of two Downtown neighborhoods among our top 10 most competitive NYC neighborhoods for amenity-rich rentals. The Lower East Side’s median net-effective rent soared 7.2% year-over-year to $5,992 in Q2, with 21.1% of listings offering concessions. Ranked ninth, the other Downtown neighborhood was the East Village, which saw 14.8% of listings offering concessions and 22.7% reducing asking rents in Q2.
Rising Inventory Led to Declining Net-Effective Rents in Queens
Amid rising inventory, the median net-effective rent for amenity-rich rentals in Queens slipped 0.1% year-over-year to $3,846 in Q2. The rise in inventory was led by Astoria and Long Island City, where inventory jumped 35.9% and 21.6% respectively. Farther from Manhattan, Jamaica is another Queens neighborhood leading the borough in inventory growth. With many high-rise rental buildings entering the market, the neighborhood’s inventory soared 79.5% year-over-year.
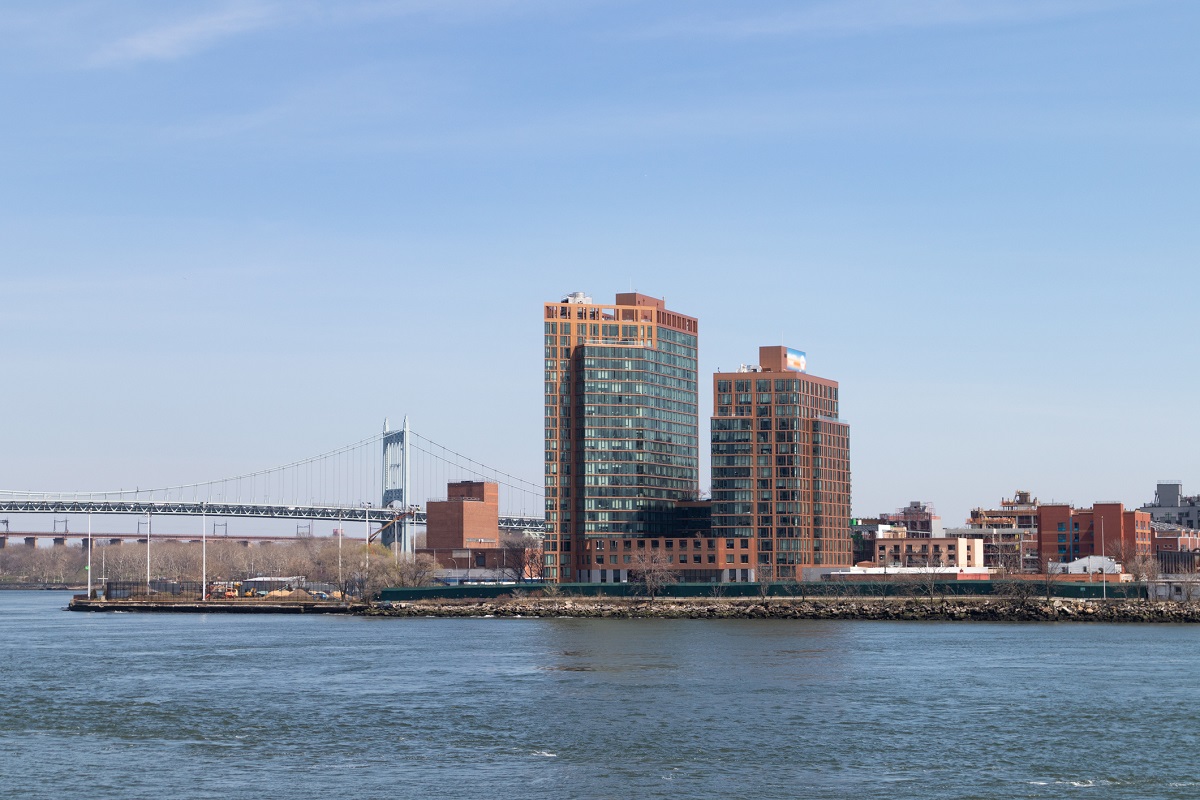
Astoria was the most competitive neighborhood for amenity-rich rentals in Queens, with rising net-effective rents and few price cuts. Astoria ranked eighth overall on our list in Q2, ahead of Long Island City. Following the influx of new developments in the neighborhood, renters are likely drawn to its waterfront location and proximity to Manhattan. The median net-effective rent in Astoria rose 1.8% year-over-year to $3,500, with just 13% of listings offering price cuts.
After ranking fifth in Q4 2024, Long Island City fell to 15th on our list. The construction boom in the neighborhood has led to a sharp increase in inventory. In Q2, there were 1,015 amenity-rich rentals on the Long Island City market — a 21.6% increase from a year ago — with about one in three (36.6%) offering concessions. The neighborhood’s median net-effective rent declined 1.5% year-over-year to $4,246 as rising inventory helped balance the growing interest in the neighborhood.
Brooklyn Remains a Sought-After Destination for Renters
Williamsburg, Flatbush, and Downtown Brooklyn claimed top spots on our list of the 10 most competitive neighborhoods for amenity-rich rentals. Brooklyn remains one of most popular destinations for renters, with a median net-effective rent of $4,250 in Q2, up 1.3% from a year ago. The borough also offered fewer concessions, with 30.5% of amenity-rich rentals advertising concessions in Q2, down from 35.0% a year ago.
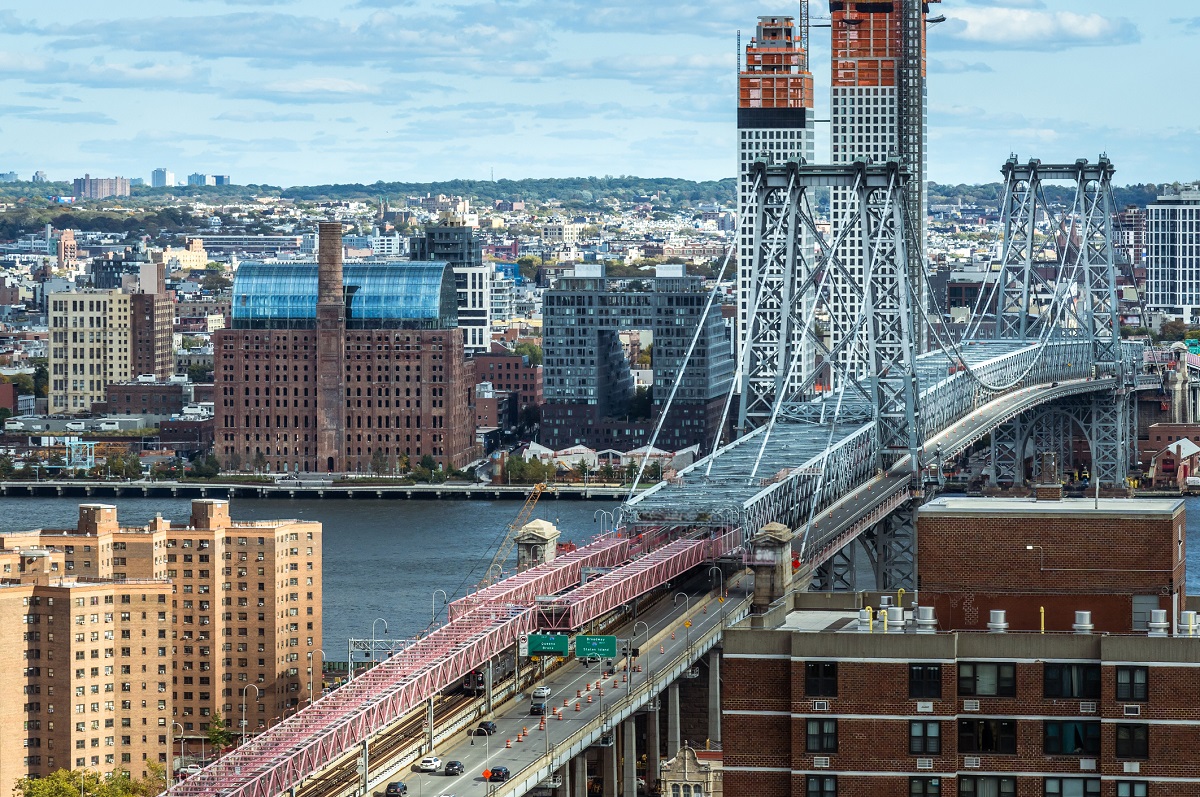
After being third in Q4 2024, Williamsburg ranked fifth on our list. In Q2, 31.5% of amenity-rich rentals in the neighborhood offered concessions, and about 12.6% lowered asking rents. The neighborhood’s median net-effective rent remained flat at $4,763 in Q2, unchanged from a year ago.
Flatbush ranked sixth on our list after ranking 11th in Q4 2024. The neighborhood has seen an increase in new developments over recent years, following a rezoning in 2009. It was also one of our 10 NYC Neighborhoods to Watch in 2024, based on annual growth in user searches on StreetEasy in 2023. In Q2, 37.6% of amenity-rich rentals in the neighborhood offered concessions, and about 13.9% lowered asking rents.
Methodology
Using StreetEasy data, we scored the competitiveness of the amenity-rich rental market in each neighborhood based on share of rentals that offered at least one month of free rent, share of rentals that reduced asking rents during their listing period, and year-over-year change in median net-effective rent. Each metric was assigned the same weight. A score of 100 means a neighborhood topped all other NYC neighborhoods in each metric. A score of 0 means a neighborhood was at the bottom for each metric. Renters can expect heightened competition for amenity-rich rentals in neighborhoods with a higher competitiveness score.
StreetEasy is an assumed name of Zillow, Inc. which has a real estate brokerage license in all 50 states and D.C. See real estate licenses. StreetEasy does not intend to interfere with any agency agreement you may have with a real estate professional or solicit your business if you are already under contract to purchase or sell property. All data for uncited sources in this presentation has been sourced from Zillow data. Copyright © 2024 by Zillow, Inc. and/or its affiliates. All rights reserved.


