

October 2025 Housing Market Report
Key Takeaways:
NYC Sales Market
- New York City saw 2,191 homes enter contract in October, up 10.4% from a year ago, as declining mortgage rates sustained the strongest fall market since 2021.
- Buyers have more options as newly listed homes soared 8.2% from a year ago, led by sellers eager to leverage strong buyer activity.
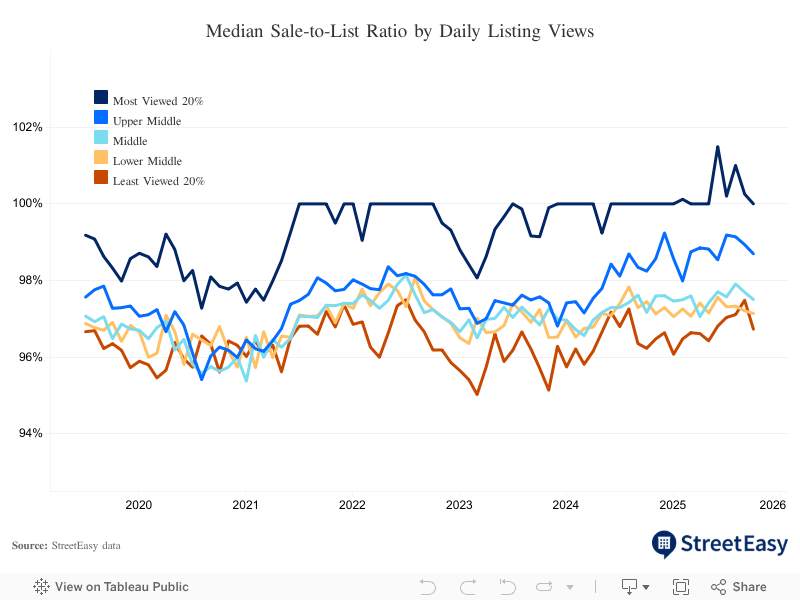
- Across the city, homes sold for a median of 97.9% of their last asking price, while the most-viewed 20% of homes on StreetEasy sold for a median of 100% of their last asking price.
NYC Rental Market
- The citywide median asking rent rose 8.2% year-over-year to $3,950 in October, as resilient renter demand and low vacancies kept pressure on the market.
- Newly listed rentals fell 2.7% from a year ago, as renters become increasingly inclined to stay put due to cooling labor market conditions.
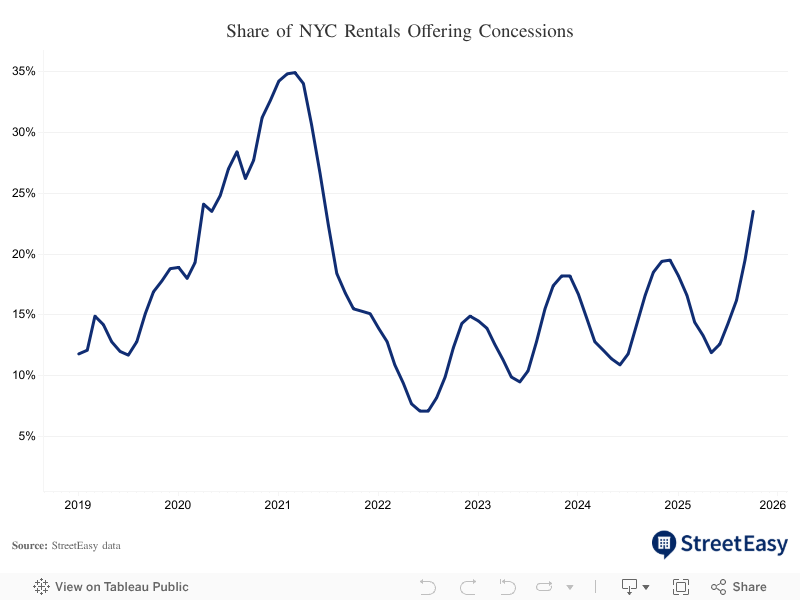
- Renters are more likely to find concessions than any time since 2021, with 23.5% of rentals offering at least one month of free rent as new developments capture a larger share of inventory.

NYC Sales Market
The market’s strong momentum continued in October with 2,191 homes entering contract across the city, marking a 10.4% rise from a year ago. Mortgage rates continued to slide in October, making it more affordable for buyers to finance their next home. New contracts jumped 29.4% from September to October, significantly higher than the average 18.9% monthly increase of the past three Octobers. With the fall market in full swing, new contracts typically increase from September to October, but this year’s rise was the highest since 2021.
Manhattan drove much of the increase in new sales contracts, indicating resilient demand for highly priced homes. The borough saw 1,060 homes enter contract in October, an 11.5% increase from a year ago. The most expensive top third led the Manhattan market, rising 31.5% to 259 homes. Meanwhile, 580 homes entered contract in Brooklyn, falling 2.4% year-over-year, while bustling co-op markets across Forest Hills, Jackson Heights, and Rego Park contributed to a 17.5% jump in all new contracts to 396 in Queens.
Sellers continued to join the market in droves. In October, 3,539 homes entered the market, an increase of 8.2% from a year ago. Nearly half (47.6%) of all new listings across the city were in Manhattan as the luxury market continued to show strength. Meanwhile, 1,006 homes were newly listed in Brooklyn, a 17.5% jump as sellers looked to leverage strong buyer interest in the borough.
NYC Homes Under $1M on StreetEasy Article continues below


The surge in new listings creates more choices for buyers — and more competition for sellers. Against this backdrop, sellers have been strategic with pricing, and as a result, asking prices have been stable despite the strongest fall market since 2021. Across the city, the median asking price of all homes on the market was $1.05M in October, nearly flat from a year ago.
As a result, astute sellers have maintained their edge. In October, NYC homes sold for a median of 97.9% of their most recent asking price. In other words, the typical room for discount for buyers was 2.1%, about the same as 2.0% in October 2021, when mortgage rates were at rock bottom and buyer competition was at its highest. The stability reflects sellers’ smart pricing to maximize buyer interest and avoid steeper price cuts during negotiations.
While market activity has been strong in NYC, sellers in some neighborhoods have shown more willingness to negotiate on price. Buyers had more room to negotiate in parts of Manhattan, such as the Financial District and Chelsea, even after considering that higher asking prices meant more room for adjustment. In the Financial District, sellers appeared willing to accept lower sale prices in exchange for a quicker sale. The median time that listings in the Financial District spent on the market before entering contract fell to 87 days in October, down significantly from 168 days a year ago. That said, pricing is specific to each property. Homes sold in Bedford-Stuyvesant showed a wide divergence in sale-to-list ratios. While 27% of homes sold above asking in the neighborhood, the median sale-to-list ratio was 96.4%, with half the homes selling with a discount of more than 4%.
NYC Neighborhoods With Lowest Sale-to-List Ratios, October 2025
| Neighborhood | Borough | Median Sale- to-List Ratio | Median Discount Off Asking Price | Median Sale Price |
|---|---|---|---|---|
| Financial District | Manhattan | 96.1% | 3.9% | $1,150,000 |
| Bedford-Stuyvesant | Brooklyn | 96.4% | 3.6% | $995,000 |
| Chelsea | Manhattan | 96.9% | 3.1% | $1,365,000 |
| Bay Ridge | Brooklyn | 97.3% | 2.7% | $694,900 |
| Midtown East | Manhattan | 97.4% | 2.6% | $699,000 |
| Midtown West | Manhattan | 97.4% | 2.6% | $950,000 |
| Gramercy Park | Manhattan | 97.5% | 2.5% | $937,000 |
| Upper West Side | Manhattan | 97.7% | 2.3% | $1,085,750 |
| Riverdale | Bronx | 97.8% | 2.2% | $400,000 |
| Forest Hills | Queens | 97.9% | 2.1% | $459,000 |
As new listings abound, maximizing visibility is paramount for sellers. Homes that are viewed more by buyers are more likely to sell at a higher price. In October, the most-viewed 20% of NYC listings on StreetEasy sold for a median of 100% of their last asking price — an enduring trend since June 2024. Meanwhile, the least-viewed 20% of listings sold for a median of 96.7%. Experienced agents can offer valuable guidance to sellers on marketing strategy and assist buyers with negotiations on popular properties.
NYC Rental Market
The citywide median asking rent was $3,950 in October, up 8.2% from a year ago. The rental market remained tight due to resilient demand and low vacancies. Across the city, 18,198 units were newly listed for rent in October, down 2.7% from a year ago. Declining new inventory likely reflects increased incentives for renters to stay put amid cooling labor market conditions, an ongoing trend since May.
As a result, the city’s rental inventory fell 6.8% year-over-year to 32,409 units. Manhattan continued to lead the city in inventory decline, falling 11.5% to 14,289 units in October — the 20th consecutive month of annual declines. The median asking rent in Manhattan held firm at $4,600 in October, up just $5 from September, though asking rents tend to decline from September to October as leasing activity winds down.
NYC Rentals Under $3,500 on StreetEasy Article continues below


Supply shortages defined the rental market as priced-out Manhattan renters looked to Brooklyn and Queens. Competition began to heat up in the two boroughs this summer, resulting in declining inventory and rising asking rents. The median asking rent in Brooklyn rose 7.2% year-over-year to $3,752 in October, while the median in Queens rose 6.7% to $3,200. Inventory was down 4.0% and 5.1%, respectively, in Brooklyn and Queens.
The bright side is that renters are more likely to find concessions in NYC than any time since 2021. With new developments capturing a larger market share, 23.5% of the city’s rentals offered at least one month of free rent, up from 18.5% a year ago and the highest level since June 2021. The Bronx had the highest share of rentals offering concessions at 43.2%, an increase from 30.6% last October. Even in competitive markets like Manhattan and Brooklyn, the share of rentals with concessions rose to 20.6% from 18.6% and 25.6% from 17.2%, respectively.
With mortgage rates expected to stay above pre-pandemic levels through next year, many NYC renters who may have considered buying will likely stay put. As vacancy rates in existing buildings continue to decline, new developments will play a key role in alleviating the strain on renters. The Bronx, which has seen thousands of new rentals since the pandemic, was the only borough with an annual increase in inventory this October. With 1,336 rentals, the borough’s inventory grew 24.4% compared to last year.
NYC Market Data: October 2025
Sales
 NYC |  Manhattan |  Brooklyn |  Queens | |
|---|---|---|---|---|
| Median asking price | $1,050,000 (-0.5% YoY) | $1,456,254 (-1.3%) | $1,099,000 (0.0%) | $674,700 (+0.9%) |
| Number of homes for sale | 17,243 (+12.8%) | 8,966 (+11.9%) | 4,239 (+11.2%) | 3,009 (+14.1%) |
| Homes entering contract | 2,191 (+10.4%) | 1,060 (+11.5%) | 580 (-2.4%) | 396 (+17.5%) |
| Median days on market | 68 (±0) | 75 (-18) | 56 (+6) | 71 (+16) |
Rentals
| NYC | Manhattan | Brooklyn | Queens | |
|---|---|---|---|---|
| Median asking rent | $3,950 (+8.2% YoY) | $4,600 (+8.2%) | $3,752 (+7.2%) | $3,200 (+6.7%) |
| Number of homes for rent | 32,409 (-6.8%) | 14,289 (-11.5%) | 11,973 (-4.0%) | 4,759 (-5.1%) |
| Share of rentals with price cuts | 18.1% (-2.0pp) | 23.7% (-1.5pp) | 14.6% (-2.4pp) | 14.5% (+0.4pp) |
| Share of rentals offering concessions* | 23.5% (+5.0pp) | 20.6% (+2.0pp) | 25.6% (+8.4pp) | 21.9% (+2.9pp) |
Curious about the value of a buyer’s agent? Speak to our licensed StreetEasy Concierge for the details and get connected with a top agent.
StreetEasy is an assumed name of Zillow, Inc. which has a real estate brokerage license in all 50 states and D.C. See real estate licenses. StreetEasy Concierge team members are real estate licensees, however they are not your agents or providing real estate brokerage services on your behalf. StreetEasy does not intend to interfere with any agency agreement you may have with a real estate professional or solicit your business if you are already under contract to purchase or sell property.