Rents in Manhattan and Brooklyn have hit record highs, according to StreetEasy’s October 2018 Market Reports.
The New York City rental market stayed hot in October, resisting the fall season’s typical cooldown, according to the October 2018 StreetEasy Market Reports [i]. The StreetEasy Rent Index [ii] increased at its fastest annual pace since 2016 in Manhattan and Brooklyn — up 2.1 percent and 1.6 percent, respectively. Rents in Queens rose 1.2 percent, reaching $2,165.
Every submarket in the three boroughs saw an increase in rents except for North Brooklyn [iii], where rents have been steadily declining ahead of the April 2019 L train shutdown. In October, the StreetEasy North Brooklyn Rent Index dipped 1.1 percent to $3,067, the largest year-over-year drop on StreetEasy record. The submarket nearly closed its price gap with Northwest Brooklyn [iv], where the StreetEasy Rent Index reached $3,051.
Despite rising rents, the share of price cuts to asking rents cuts rose from their low levels this summer. In Manhattan, landlords cut rents on nearly 1 in 4 units (24.2 percent), adjusting prices on aggressively priced rentals that were not leased in the warmer months. Still, Manhattan’s share of units with asking rent cuts dropped 3 percentage points annually, reflecting the strong demand from renters this year across asking prices.
“With interest rates rising, and buyers uncertain about the implications of the tax plan, many New Yorkers are finding value in the flexibility of renting over buying in a market with sky-high prices,” says StreetEasy Senior Economist Grant Long. “These would-be buyers are contributing to rents heating up at a time when they’d normally cool. This trend will likely continue until prices in the sales market drop to levels deemed acceptable by these buyers — making for an unusually competitive winter rental season ahead.”
October 2018 Key Findings — Manhattan
- Rents matched their all-time high. The StreetEasy Manhattan Rent Index increased 2.1 percent annually, reaching $3,220 — an all-time high first hit in September of this year.
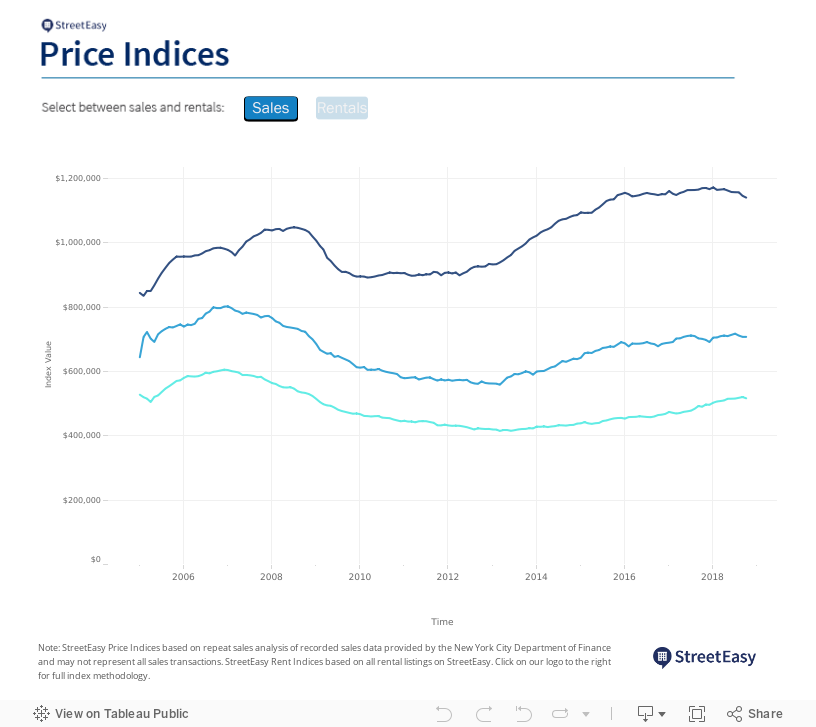
- Sales prices dropped at the fastest pace on record. The StreetEasy Manhattan Price Index [v] dropped 2.5 percent to $1,140,151 — its lowest level since 2015.
- More than 2,000 new homes hit the market. In Manhattan, 2,126 homes were listed in October — 20.8 percent more homes than last year.
- Sellers offered more price cuts than ever. Some 17.7 percent of homes received a price cut – an increase of 3.6 percentage points from last year, and the highest share on record.
- Recorded sales continued to drop. The number of recorded sales [vi] in Manhattan dropped 14.0 percent annually to 886 total sales.
October 2018 Key Findings — Brooklyn
- Rents rose at the fastest pace since 2016. The StreetEasy Brooklyn Rent Index increased 1.6 percent annually to $2,599. Rents rose the most in Northwest Brooklyn, reaching $3,051 — an increase of 2.6 percent from last year.
- The share of rent cuts was down. The share of units offering a rent cut dropped 3.4 percentage points to 20.4 percent.
- Prices increased slightly. The StreetEasy Brooklyn Price Index increased 0.9 percent to $707,321. Prices rose the most in South Brooklyn [vii], up 4.4 percent to $719,757.
- New inventory continued to climb. Like Manhattan, 30.8 percent more homes hit the market in Brooklyn than this time last year. In October, 1,440 homes were listed for sale across the borough.
- The share of homes with price cuts rose. The share of sales with a price cut rose 5.8 percentage points year-over-year to 16.3 percent. Prospective buyers were most likely to find a discount in East Brooklyn [viii], where nearly 1 in 5 homes (19.2 percent) had a price cut in October.
October 2018 Key Findings — Queens
- Rents reached an all-time high. The StreetEasy Queens Rent Index increased 1.2 percent annually, reaching $2,165.
- Landlords cut rents on 1 in 5 units. In October, 20.6 percent of homes experienced a rent cut, down 3.9 percentage points from last year. The share of rent cuts dipped the most in Northwest Queens [ix] — down 7.4 percentage points to 20.6 percent.
- Prices continued to rise. The StreetEasy Queens Price Index increased 5.4 percent to $516,507. Home prices rose in every Queens submarket, led by growth in the Rockaways [x], where prices rose 12 percent to $496,775.
- Recorded sales dipped. The number of recorded sales in Queens dropped 18.7 percent in October to 1,303. Despite the annual drop, Queens still saw the largest number of sales compared to Manhattan and Brooklyn.
- The number of sellers offering a price cut rose. In Queens, 13.6 percent of listings experienced a price cut in October — up 4.8 percentage points from last year.
[i] The StreetEasy Market Reports are a monthly overview of the Manhattan, Brooklyn and Queens sales and rental markets. Every three months, a quarterly analysis is published. The report data is aggregated from public recorded sales and listings data from real estate brokerages that provide comprehensive coverage of Manhattan, Brooklyn and Queens, with more than a decade of history for most metrics. The reports are compiled by the StreetEasy Research team. For more information, visit https://streeteasy.com/blog/research/market-reports/. StreetEasy tracks data for all five boroughs within New York City, but currently only produces reports for Manhattan, Brooklyn and Queens.
[ii] The StreetEasy Rent Indices are monthly indices that track changes in rent for all housing types and are currently available from January 2007 in Manhattan, January 2010 in Brooklyn, and January 2012 in Queens. Each index uses a repeat-sales method similar that used to calculate the StreetEasy Price Indices. The repeat method evaluates rental price growth based on homes in a given geography that have listed for rent more than once. More details on methodology here.
[iii] The North Brooklyn submarket includes Greenpoint, Williamsburg and East Williamsburg.
[iv] The Northwest Brooklyn submarket includes Downtown Brooklyn, Fort Greene, Brooklyn Heights, Boerum Hill, Dumbo, Red Hook, Gowanus, Carroll Gardens, Cobble Hill, Columbia St. Waterfront District and Clinton Hill.
[v] The StreetEasy Price Indices track changes in resale prices of condo, co-op, and townhouse units. Each index uses a repeat-sales method of comparing the sales prices of the same properties since January 1995 in Manhattan and January 2007 in Brooklyn and Queens. Given this methodology, each index accurately captures the change in home prices by controlling for the varying composition of homes sold in a given month. Levels of the StreetEasy Price Indices reflect average values of homes on the market. Data on the sale of homes is sourced from the New York City Department of Finance. Full methodology here.
[vi] Recorded sales are projected for the period based upon 1) data received from the New York City Department of Finance through the final day of the period and 2) historical seasonal trends.
[vii] The South Brooklyn submarket includes Sunset Park, Bay Ridge, Dyker Heights, Bensonhurst, Bath Beach, Gravesend, Borough Park, Ocean Parkway, Kensington, Coney Island, Brighton Beach, Ditmas Park, Seagate, Flatbush, Midwood, Sheepshead Bay, Manhattan Beach, East Flatbush, Canarsie, Flatlands, Marine Park, Mill Basin, Bergen Beach, Old Mill Basin, Greenwood and Gerritsen Beach.
[viii] The East Brooklyn submarket includes Bedford-Stuyvesant, Bushwick, East New York, Crown Heights and Brownsville.
[ix] The Northwest Queens submarket includes Astoria, Long Island City, Sunnyside and Ditmars-Steinway.
[x] The Rockaways submarket includes Far Rockaway, Broad Channel, Arverne, Rockaway Park, Bayswater, Belle Harbor, Breezy Point, Neponsit, Edgemere and Hammels.
—
Hey, why not like StreetEasy on Facebook and follow @streeteasy on Instagram?