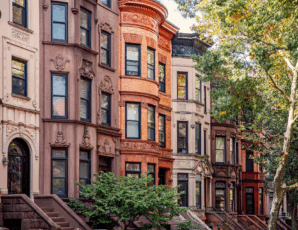
The StreetEasy Q1 2019 Market Reports show the NYC home sales market struggling as rents reach new levels. (Getty Images)
As the New York City sales market continued to weaken in the first quarter of 2018, asking rents across the city rose to record highs, according to the latest StreetEasy Market Reports.
The StreetEasy Manhattan Rent Index [i] reached a new peak for any first quarter at $3,217, while rents in Brooklyn and Queens reached all-time highs of $2,608 and $2,173, respectively. Rents declined in only one area of the city, North Brooklyn [ii], amid an oversupply of inventory that remained vacant as a result of the anticipated L train shutdown. Rents in the submarket fell to $3,061, a slight decrease of 0.5%.
As rents rose, landlords were less likely to offer markdowns on asking prices. All analyzed boroughs saw a significant reduction in the share of units offering rent cuts. Brooklyn’s share saw the largest year-over-year drop since 2011: down 6.7 percentage points from last year to 17.1% of units. At the same time, the median rent cut also shrank in all three boroughs, dropping to the smallest discount on record in Brooklyn and Queens, each at 3.4%, and dipping close to an all-time low in Manhattan at 3.9%.
“We’re coming out of an unusually competitive winter rental season in which many renters found themselves in a weaker negotiating position than in years past,” says StreetEasy Senior Economist Grant Long. “As would-be buyers opt to embrace renting while sale prices are falling, the competition that new grads and other transplants entering the city’s workforce would typically bring this time of year will be even more pronounced. This spring, landlords will have the upper hand, and renters should be prepared to move quickly to make sure they get a place they love.”
See below for additional sales and rental market trends across Manhattan, Brooklyn and Queens.
Q1 2019 Key Findings — Manhattan
- Rents rose at the fastest pace since 2016. The StreetEasy Manhattan Rent Index rose to $3,217 — the highest first-quarter level on record, up 2.6% since last year. Rents in Manhattan have not risen this quickly since 2016.
- Rent cuts were harder to find and smaller than ever. The share of rent cuts dipped 3.6 percentage points, down to 23.4%. The median rent cut also decreased slightly to 3.9% — down 0.2 percentage points from last year.
- Sales prices dropped at the fastest pace since 2010. The StreetEasy Manhattan Price Index [iii] fell 5% to $1,105,671. Prices in Midtown [iv] dropped the most, falling 5.5% to $1,155,483 — a low not seen since 2015.
- Price levels in the luxury market dipped below $4 million. The StreetEasy Price Index for the luxury tier — the top 20% of the market — dipped below $4 million for the first time since 2013. Luxury prices were down 4.7% to $3,982,868.
- 1 in 4 homes had a price cut. Nearly a quarter of Manhattan homes (24.6%) received a price cut in the first quarter — with the share rising 2.6 percentage points since last year.
Q1 2019 Key Findings — Brooklyn
- Rents reached an all-time high. The StreetEasy Brooklyn Rent Index rose 2.2% to $2,608, an all-time high for the borough. Northwest Brooklyn rents rose the most — up 3.3% to $3,068.
- The share of rent cuts fell the most. Only 17.1% of rentals had a price cut in the first quarter, down 6.7 percentage points from last year and dipping to the lowest share since 2011.
- Sales prices rose slightly. The StreetEasy Brooklyn Price Index rose 0.4% to $712,413. Prices increased the most in South Brooklyn [v] — up 4.6% to $726,979.
- More sellers cut their asking price. The share of homes with price cuts rose 6.3 percentage points to 21.2% borough-wide. While the share of price cuts grew, the median price cut remained unchanged from the previous year at 5.2%.
- Homes took two weeks longer to sell. Homes for sale stayed on the market for 14 days longer than last year — up to 85 days total, the longest period since 2012.
Q1 2019 Key Findings — Queens
- Rents reached an all-time high. The StreetEasy Queens Rent Index increased 2.5% to an all-time high of $2,173. Rents in Northwest Queens [vi] rose the most — up 2.3% to $2,264.
- Landlords offered rent cuts on 1 in 5 units. The share of rent cuts fell to 20.6% in the borough — down 2.0 percentage points annually. Discounts were hardest to find in Northeast Queens [vii], where the share dropped 2.7 percentage points to 19.2%.
- Defying the broader slowdown, Queens home prices continued to rise. The StreetEasy Queens Price Index increased 3.0% year-over-year to $517,996.
- Sales inventory increased significantly. Inventory jumped 26.1% over the same time last year in the borough, bringing the number of homes for sale close to an all-time high of 4,435.
- Price cuts were rare but more common than last year. Queens sellers were the least likely to cut their asking price, with 17% of homes offering a discount, up 5.0 percentage points from last year.
View the complete StreetEasy Market Reports for Manhattan, Brooklyn and Queens with additional neighborhood data and graphics. See definitions of StreetEasy’s metrics and monthly data from each report.
[i] The StreetEasy Rent Indices are monthly indices that track changes in rent for all housing types and are currently available from January 2007 in Manhattan, January 2010 in Brooklyn, and January 2012 in Queens. Each index uses a repeat-sales method similar that used to calculate the StreetEasy Price Indices. The repeat method evaluates rental price growth based on homes in a given geography that have listed for rent more than once. More details on methodology here.
[ii] The North Brooklyn submarket includes Greenpoint, Williamsburg and East Williamsburg.
[iii] The StreetEasy Price Indices track changes in resale prices of condo, co-op, and townhouse units. Each index uses a repeat-sales method of comparing the sales prices of the same properties since January 1995 in Manhattan and January 2007 in Brooklyn and Queens. Given this methodology, each index accurately captures the change in home prices by controlling for the varying composition of homes sold in a given month. Levels of the StreetEasy Price Indices reflect average values of homes on the market. Data on the sale of homes is sourced from the New York City Department of Finance. Full methodology here.
[iv] The Midtown submarket includes Roosevelt Island, Midtown, Central Park South, Midtown South, Midtown East and Midtown West.
[v] The South Brooklyn submarket includes Sunset Park, Bay Ridge, Dyker Heights, Bensonhurst, Bath Beach, Gravesend, Borough Park, Kensington, Coney Island, Brighton Beach, Ditmas Park, Seagate, Flatbush, Midwood, Sheepshead Bay, Manhattan Beach, East Flatbush, Canarsie, Flatlands, Marine Park, Bergen Beach, Old Mill Basin, Greenwood and Gerritsen Beach.
[vi] The Northwest Queens submarket includes Astoria, Long Island City, Sunnyside and Ditmars-Steinway.
[vii] The Northeast Queens submarket includes Flushing, Whitestone, College Point, Fresh Meadows, Kew Gardens Hills, Kew Gardens, Bayside, Douglaston, Little Neck, Auburndale, Glen Oaks, Floral Park, Bellerose, Briarwood, New Hyde Park, Oakland Gardens, Hillcrest, Pomonok, Utopia, Bowne Park, Clearview, Alley Park and Queensboro Hill.
—
Send your NYC real estate stories and tips to StreetEasy editors at tips@streeteasy.com. You will remain anonymous. And hey, why not like StreetEasy on Facebook and follow @streeteasy on Instagram?


