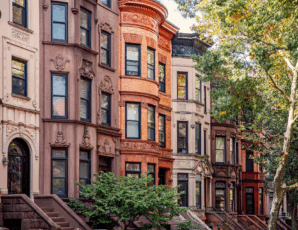
Q2 data shows a flurry of buying activity occurred, potentially to avoid the July 1 mansion tax hike. (Getty Images)
With a higher New York City mansion tax looming, buyers and sellers rushed to close deals on expensive homes in the second quarter of 2019, driving the median recorded sale price in Manhattan to a record high of $1,161,496 — an 11% increase from last year, according to StreetEasy’s Q2 2019 Market Reports.[i].
Also on the rise was the number of homes that entered contract[ii] during the second quarter of 2019: Pending sales increased by 6.4% in Manhattan ahead of the July 1 mansion tax hike. Brooklyn and Queens also experienced an uptick in sales, at 6.4% and 15.9%, respectively.
After several months of decline, New York City home prices began to level out in the second quarter of 2019[iii]. The StreetEasy Manhattan Price Index[iv] dropped 3.7% from last year to $1,113,201, but prices in the borough were still higher than in the first quarter of 2019. Prices in Brooklyn remained stagnant, at $711,410, and the StreetEasy Queens Price Index rose 1.5% year over year to $516,374, the slowest rate of growth since 2013.
These signs point to a seemingly strengthening market. But even with a wave of home sales this spring, and annual increases in the number of homes entering contract in all three boroughs analyzed, a large surplus of inventory remains. Brooklyn and Queens saw more homes for sale than ever during the second quarter: 8,249 in Brooklyn, up 13.0% from last year, and 4,895 in Queens, up 14.5%. Meanwhile, Manhattan inventory hit its highest level since 2011, with 13,543 homes on the market.
“Lower mortgage rates, a strong economy and steady job growth have kept demand for homes in New York City high, helping give the sales market a much-needed boost after a year of weakness,” says StreetEasy Senior Economist Grant Long. “The looming mansion tax also spurred a flurry of sales activity in the second quarter, as sellers and buyers raced to close ahead of the July 1 deadline. While this comes as encouraging news for sellers, it remains to be seen how well this market will be able to absorb the surplus of homes currently for sale across price points.”
See below for additional sales and rental market trends across Manhattan, Brooklyn and Queens.
StreetEasy’s Q2 2019 Market Reports Key Findings — Manhattan
- Prices dropped, but at a slower rate than last quarter. The StreetEasy Manhattan Price Index fell to $1,113,201, a 3.7% year-over-year decrease. This dip in prices was exactly 1 percentage point smaller than last quarter, when prices dropped 4.7% annually to $1,107,863.
- More homes went into contract. In Manhattan, 3,179 homes went into contract – a 6.4% jump from last year. The number of homes going into contract increased in every submarket but Midtown[v], where it fell 1.2%.
- Inventory rose across the borough. All five Manhattan submarkets saw an increase in inventory, resulting in a 7.1% jump since last year in the number of homes for sale, to 13,543. The luxury market (the top 20% of homes by price) experienced a 7.1% decrease in inventory year over year, the largest drop in two years.
- Homes lingered on the market for two weeks longer. Median days on market increased by 14 days, to 75 days total. Homes in Midtown spent 91 days on the market — 20 days longer than last year, and the longest period of any submarket in the borough.
- Price cuts dropped on the Upper East Side and Upper West Side. The share of price cuts in Manhattan remained about the same as last year, increasing 0.1 percentage points to 28.1%. The share of price cuts dropped only on the Upper East Side[vi] and Upper West Side[vii], where it fell by 1.6 percentage points and 2.2 percentage points, respectively.
StreetEasy’s Q2 2019 Market Reports Key Findings — Brooklyn
- Prices were unchanged. The StreetEasy Brooklyn Price Index remained about the same as last year at $711,410 — a slight increase of 0.3%. Prices rose the most in South Brooklyn[viii], up 3.0% to $723,713.
- More homes went into contract. The number of homes entering contract in North Brooklyn[ix], the most expensive submarket in the borough, jumped 19.3% in the second quarter. Brooklyn-wide, the number of homes entering contract rose by 6.4%.
- Inventory reached an all-time high. The amount of for-sale inventory in Brooklyn rose to a record high of 8,249 homes, up 13.0% since last year. All five submarkets experienced an increase in inventory, with South Brooklyn recording the largest increase, at 16.9%.
- Homes idled on the market for nearly a week longer. Median days on market rose by six days, to 59 days. Homes lingered on the market for longer in every submarket except for Northwest Brooklyn[x], where the median days on market remained unchanged at 46 days.
- One in four sellers offered price cuts. The share of price cuts in the borough increased by 4.0 percentage points to 25%, the highest level since 2010.
StreetEasy Q2 2019 Market Reports — Queens
- Prices rose at their slowest rate in six years. The StreetEasy Queens Price Index rose 1.5% to $516,374, the slowest pace of growth in the borough since the fourth quarter of 2013.
- Pending sales spiked. Of the boroughs analyzed, Queens saw the largest annual jump in the number of homes entering contract at 15.9%. Compared to last year, 179 more homes entered contract, resulting in the highest number of pending sales on record (1,302).
- There was more inventory on the market than ever before. Queens saw a 14.5% uptick in inventory in the second quarter, and its 4,895 homes for sale set a second-quarter record.
- Homes sold the fastest in Queens. Median days on market in Queens increased by four days since last year, to 58 days. Homes in Northwest Queens[xi] sold faster than last year, quickening by 8 days to a median of 48 days.
- More sellers offered price cuts than ever. The share of homes with a price cut rose 3.3 percentage points to a new borough record of 20.8%. The share of price cuts fell in one submarket – Northwest Queens – by 4.9 percentage points, to 22.0%.
Definitions of StreetEasy’s metrics and monthly data from each report can be explored and downloaded via the StreetEasy Data Dashboard. For a look at the latest capabilities of the StreetEasy Data Dashboard, which was revamped in June, visit here.
About StreetEasy
StreetEasy is New York City’s leading local real estate marketplace on mobile and the web, providing accurate and comprehensive for-sale and for-rent listings from hundreds of real estate brokerages throughout New York City. StreetEasy adds layers of proprietary data and useful search tools to help home shoppers and real estate professionals navigate the complex real estate markets within the five boroughs of New York City, as well as Northern New Jersey.
—
[i] The StreetEasy Market Reports are a monthly overview of the Manhattan, Brooklyn and Queens sales and rental markets. Every three months, a quarterly analysis is published. The report data is aggregated from public recorded sales and listings data from real estate brokerages that provide comprehensive coverage of Manhattan, Brooklyn, and Queens, with more than a decade of history for most metrics. The reports are compiled by the StreetEasy Research team. For more information, visit https://streeteasy.com/blog/research/market-reports. StreetEasy tracks data for all five boroughs within New York City, but currently only produces reports for Manhattan, Brooklyn, and Queens.
[ii] StreetEasy defines pending sales as homes that are in-contract. An offer has been made and accepted, and the closing is pending.
[iii] The StreetEasy Market Reports are a monthly overview of the Manhattan, Brooklyn and Queens sales and rental markets. Every three months, a quarterly analysis is published. The report data is aggregated from public recorded sales and listings data from real estate brokerages that provide comprehensive coverage of Manhattan, Brooklyn and Queens, with more than a decade of history for most metrics. The reports are compiled by the StreetEasy Research team. For more information, visit https://streeteasy.com/blog/research/market-reports. StreetEasy tracks data for all five boroughs within New York City, but currently only produces reports for Manhattan, Brooklyn and Queens.
[iv] The StreetEasy Price Indices track changes in resale prices of condo, co-op, and townhouse units. Each index uses a repeat-sales method of comparing the sales prices of the same properties since January 1995 in Manhattan and January 2007 in Brooklyn and Queens. Given this methodology, each index accurately captures the change in home prices by controlling for the varying composition of homes sold in a given month. Levels of the StreetEasy Price Indices reflect average values of homes on the market. Data on the sale of homes is sourced from the New York City Department of Finance. Full methodology here.
[v] The Midtown submarket includes Midtown, Central Park South, Midtown South, Midtown East and Midtown West.
[vi] The Upper East Side submarket includes Lenox Hill, Yorkville, Carnegie Hill and Upper Carnegie Hill.
[vii] The Upper West Side submarket includes Lincoln Square, Manhattan Valley and Morningside Heights.
[viii] The South Brooklyn submarket includes Sunset Park, Bay Ridge, Dyker Heights, Bensonhurst, Bath Beach, Gravesend, Borough Park, Ocean Parkway, Kensington, Coney Island, Brighton Beach, Ditmas Park, Seagate, Flatbush, Midwood, Sheepshead Bay, Manhattan Beach, East Flatbush, Canarsie, Flatlands, Marine Park, Mill Basin, Bergen Beach, Old Mill Basin, Greenwood and Gerritsen Beach.
[ix] The North Brooklyn submarket includes Greenpoint and Williamsburg.
[x] The Northwest Brooklyn submarket includes Downtown Brooklyn, Fort Greene, Brooklyn Heights, Boerum Hill, DUMBO, Red Hook, Gowanus, Carroll Gardens, Cobble Hill, Columbia St. Waterfront District and Clinton Hill.
[xi] The Northwest Queens submarket includes Astoria, Long Island City, Sunnyside and Ditmars-Steinway.


