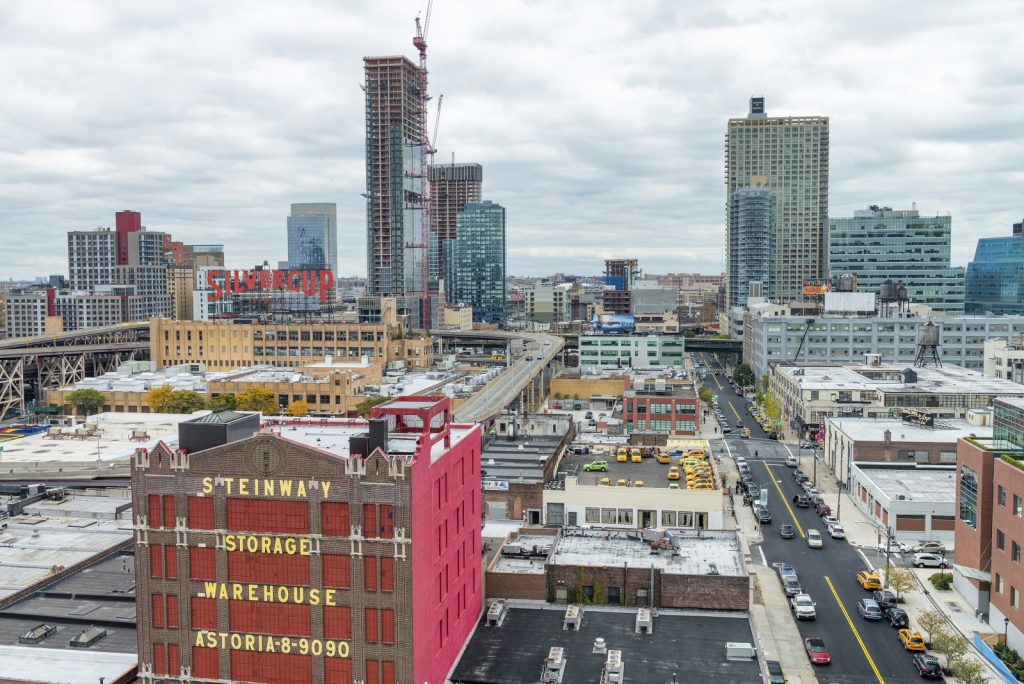
As the typical winter slowdown hit the New York City real estate market in late 2017, landlords cut asking rents, causing the share of rental discounts to rise dramatically across Manhattan, Brooklyn and Queens, according to the Q4 2017 StreetEasy® Market Reports [i].
More than one-third of Manhattan rentals (34 percent) and 28 percent of Queens rentals received price cuts in the last quarter of 2017 — the highest levels on StreetEasy record [ii]. Twenty-eight percent of rentals in Brooklyn saw a price cut, just below the borough’s all-time high of 29 percent, recorded in the fourth quarter of 2016.
Compared to the same time the previous year, median rents in Manhattan and Brooklyn were essentially flat at $3,125 and $2,524, up only 0.1 percent and 0.4 percent, respectively. Despite seeing the sharpest growth of the three boroughs in 2017, median rent in Queens dropped 1.3 percent year-over-year to $2,066, making this the first quarter to show a rent decline since StreetEasy began tracking rents in the borough in 2012 [iii]. Within each borough, all submarket rents grew less than 2 percent year-over-year. The largest rent drops were recorded in Northwest Queens (down 2.5 percent, to $2,129) and Prospect Park (down 0.9 percent, to $2,619).
“While a flood of new construction has been the main driver of the rental market slowdown we’ve witnessed over the last year, the fourth quarter’s rent cuts are more far-reaching than in years past,” said StreetEasy Senior Economist Grant Long. “The cooling in the market is no longer limited to new, high-end buildings in select pockets of the city — there’s a broader trend of rents topping out across all price points. The slowdown is forcing landlords across the city to cut deals, and renters now have the most negotiating leverage in years.”
Q4 2017 Key Findings – Manhattan
- Rents stagnated, mirroring 2016 levels. They rose just 0.1 percent — or $5 — over the fourth quarter of 2016, reaching a median of $3,125 [iv].
- Rental discounts hit a record high. More than one third (34 percent) of rental units on StreetEasy received cuts to their asking rent in late 2017. Units in Stuyvesant Town/Peter Cooper Village, Morningside Heights, and Lincoln Square saw the most cuts — to 57, 54, and 45 percent of their units, respectively.
- Manhattan resale prices stagnated. The median rose just 0.6 percent to $1,166,565v.
- Upper Manhattan resale prices reached an all-time high. Upper Manhattan prices rose the most of any submarket — up 4.5 percent to $528,912.
- Luxury home prices fell. Prices for the most expensive homes fell by 1.9 percent since last year to a median of $4,238,027. Units in the Upper West Side offered the most price cuts, with 24 percent of luxury units seeing their prices reduced, up from 17 percent during the same period last year.
Q4 2017 Key Findings – Brooklyn
- Brooklyn rents grew at the slowest pace on record. Median rents rose just 0.4 percent to $2,524, marking the slowest growth rate ever recorded by StreetEasy in the borough.
- Prospect Park rents dropped the most. Rents fell 0.9 percent year-over-year to $2,619, the most of any Brooklyn submarket. Thirty percent of units in the submarket received cuts to their asking rent in the fourth quarter of 2017 — 4 percent more than last year, and an all-time high.
- Rental units offering discounts reached their second-highest level. Twenty-eight percent of Brooklyn rentals listed during the quarter had their asking rents cut, just shy of the borough’s record high of 29 percent in the same period in 2016. Rent cuts were most prevalent in Downtown Brooklyn (46 percent), Dumbo (43 percent), and Cobble Hill (36 percent).
- Resale prices rose. Despite stagnating at the end of 2016, Brooklyn resales prices grew 2.5 percent since last year to $748,527.
- North Brooklyn prices grew to their highest levels, while inventory fell. Despite falling prices in 2016 following the announcement of the L train shutdown, North Brooklyn resale prices grew 6.2 percent to a median of $1,165,030, the highest resale price on record. Meanwhile, inventory fell by 9.2 percent, marking the first time that inventory has declined in the area since 2013.
Q4 2017 Key Findings – Queens
- Queens median rents dropped. Despite steady rent growth in 2017, rents in Queens fell 1.3 percent year-over-year in the final quarter to a median of $2,066.
- Rents fell the most in Northwest Queens. The decline in Queens was largely driven by Northwest Queens, where rents fell 2.5 percent amid a glut of high-end homes in the area.
- Cuts to rents reached an all-time high. Landlords cut asking rents on 28 percent of Queens rentals in the fourth quarter of 2017 — up 2 percent since last year. Rent cuts were most prevalent in Corona (44 percent), College Point (36 percent), and Long Island City (33 percent).
- Queens resale prices rose twice as fast as last year. The median resale price in Queens rose 6.1 percent year-over-year to $509,217. The borough’s price growth was led by Central and Northeast Queens, where resale prices rose more than 8 percent.
- Northeast Queens’ resale price was highest on record. Resale prices in Northeast Queens grew 8.2 percent to a median of $588,052, the highest ever recorded by StreetEasy.
[i] The StreetEasy Market Reports are a monthly overview of the Manhattan, Brooklyn and Queens sales and rental markets. Every three months, a quarterly analysis is published. The report data is aggregated from public recorded sales and listings data from real estate brokerages that provide comprehensive coverage of Manhattan, Brooklyn and Queens with more than a decade of history for most metrics. The reports are compiled by the StreetEasy Research team. For more information, visit http://streeteasy.com/blog/research/market-reports/. StreetEasy tracks data for all five boroughs within New York City, but currently only produces reports for Manhattan, Brooklyn and Queens.
[ii] StreetEasy tracks the share of rentals discounted since 2010 in Manhattan, Brooklyn, and Queens.
[iii] StreetEasy tracks rent prices and annual growth rates from 2007 in Manhattan, 2010 in Brooklyn, and 2012 in Queens.
[iv] Similar to the StreetEasy Price Indices, median rents are measured by the StreetEasy Rent Indices. By including only valid and verified listings from StreetEasy and employing a repeat-rentals approach, the indices emphasize the changes in rent on individual properties and not between different sets of properties. Full methodology here: http://streeteasy.com/blog/methodology-price-and-rent-indices/
v Median resale price is measured by the StreetEasy Price Indices, monthly indices that track changes in resale prices of condo, co-op, and townhouse units. Each index uses a repeat-sales method of comparing the sales prices of the same properties since January 1995 in Manhattan and January 2007 in Brooklyn and Queens. Given this methodology, each index accurately captures the change in home prices by controlling for the varying composition of homes sold in a given month. Data on the sale of homes is sourced from the New York City Department of Finance. Full methodology here: http://streeteasy.com/blog/methodology-price-and-rent-indices/
—
Hey, why not like StreetEasy on Facebook and follow @streeteasy on Instagram?


