
Key Takeaways:
- The number of sponsor condos entering contract in New York City soared 80.7% year-over-year in Q4 2024 as buyers seized on the temporary relief in mortgage rates.
- New sponsor contracts more than doubled in Manhattan as the luxury segment heated up — a trend that will likely continue in 2025.
- Renter competition is heating up in Manhattan due to shrinking inventory, but rising inventory driven by new developments is expanding renters’ options in the outer boroughs and will boost demand for rentals across the East River.
- The rising popularity of Brooklyn and Queens reflects renters’ heightened price sensitivity, with every 1% price difference from similar rentals associated with a 1.5% drop in demand in Q4 2024, compared to 1.2% in Q4 2019 and 0.6% in Q4 2020.
- Given the most-searched neighborhoods on StreetEasy in 2024, renters were least likely to find what they were looking for in Manhattan, another incentive for them to weigh their options in the outer boroughs.
Manhattan’s Sponsor Condo Market Is Heating Up
Across New York City, 748 sponsor condo units entered contract in Q4 2024 — an 80.7% jump from one year ago — after a temporary decline in mortgage rates in Q3 helped many buyers re-enter the market. While rates have bounced back to 7% since then, the pace of sponsor condos entering contract remained brisk in Q4.
Compared to 2023, 2024 was a more favorable market for buyers. While rates were volatile last year, their overall decline helped more buyers return to the NYC market. For those looking for sponsor condos, the steady flow of new developments expanded their options. In Q4 2024, 2,947 sponsor condos were on the market, a 10.9% increase from a year ago. Manhattan remains the largest market with 1,427 sponsor condo listings in Q4 2024, up 10.2% from Q4 2023.
In addition to resilient demand, limited inventory of previously owned homes will continue to support sponsor condo sales in 2025. Excluding sponsor condos, there were 18,653 resale listings in Q4 2024 in NYC, a decline of 3.6% from Q4 2023.

An area of strength will be the Manhattan luxury market. Following declines in asking prices in 2024, wealthy buyers will find luxury properties more attractive this year — one of our NYC housing market predictions for 2025. The sharp jump in new sponsor contracts in Manhattan, which has a higher concentration of luxury properties, bodes well for the borough’s luxury market. In Q4 2024, the number of sponsor condos in Manhattan entering contract more than doubled from a year ago to 335 units, and 93 of them were priced above $4.4M: the starting price of the most expensive 10% of the NYC market at the time.
The gap between the final sale price and initial asking price tightened in Manhattan as the sponsor condo market heated up. In Q4 2024, the median sale-to-list ratio was 97.1% in Manhattan, indicating that a typical sponsor condo sold with a 2.9% discount off its original asking price. By comparison, Q4 2023 was a challenge, with a typical sponsor condo selling with a 5.4% discount in Manhattan.
In 2024, amid high interest rates and economic uncertainty, buyers appeared more patient and less willing to overspend. As these challenges gradually abate this year, buyer demand will likely remain resilient.
Strong Demand and Low Inventory Set the Stage for Higher Asking Rents in Manhattan
The overall rental market is tightening in Manhattan. In Q4 2024, the number of inquiries an average rental listing received jumped 8.5% year-over-year. While demand remained stable, declining inventory led to heightened competition, as elevated mortgage rates kept would-be buyers in the borough’s rental market and depressed vacancy rates.
Meanwhile, renter competition is cooling in Brooklyn, Queens, and the Bronx. In Q4, an average rental listing in the Bronx received 30.6% fewer inquiries than a year ago, while Brooklyn and Queens saw declines of 10.1% and 16.3% respectively. As new developments enter the market, inventory has been rising in the outer boroughs, resulting in milder competition and slower rent growth.
As competition intensifies in Manhattan, the market for “amenity-rich” rentals — defined as rentals with in-unit laundry, a dishwasher, an elevator, a doorman, and a fitness center or pool in the building — is also heating up. In Q4 2024, an average amenity-rich rental listing in Manhattan saw an 8.1% jump in renter inquiries from a year ago. By contrast, typical amenity-rich rental listings in Brooklyn and Queens experienced 15.4% and 10.2% declines, respectively. In the Bronx, this measure dropped by 4.2% from a year ago.

The median net-effective rent for amenity-rich rentals in Manhattan rose steadily across all bedroom counts but studios in Q4, likely reflecting increased renter competition in the borough. In particular, amenity-rich rentals with at least three bedrooms saw a sharp 10.3% jump, as demand for luxury rentals in Manhattan remained strong in 2024. While inventory of rentals of this size declined in Q4 2024, those on the market were more expensive than a year ago. In Q4 2024, 73% of amenity-rich rentals with at least three bedrooms were priced above $10,000 after accounting for concessions, higher than 65% in Q4 2023.
In Brooklyn, the median net-effective rent for amenity-rich rentals with at least three bedrooms fell 13.7% year-over-year in Q4 2024, as new construction expanded inventory at lower price points. Many of the newly built rentals with at least three bedrooms were concentrated in Crown Heights, Greenpoint, and Williamsburg in Q4.
In Queens, the median net-effective rent for a two-bedroom amenity-rich unit soared 27.3% from a year ago. While there were more two-bedroom rentals than a year ago, many of them were in new developments with higher price points. The decline in net-effective rents across all bedroom counts in the Bronx likely reflects the sharp increase in inventory and prevalence of concessions in the borough.

While citywide amenity-rich rental inventory rose in 2024, most of the increases were in the outer boroughs. In Q4, 4,279 amenity-rich units were on the market in Brooklyn, 58.2% higher than in Q4 2023. In Queens, 1,808 amenity-rich units were on the market, a 32.1% jump from a year ago. The Bronx also grew its share of amenity-rich rentals with 533 units on the market, a 79.5% surge from Q4 2023.
By contrast, amenity-rich rental inventory in Manhattan fell 6.2% year-over-year to 4,578 units in Q4 — the lowest since Q4 2022. Tighter market conditions likely allowed landlords to avoid price cuts and pull back on concessions. Our December market report showed that most neighborhoods with the highest shares of rental concessions, defined as at least one month of free rent, were in Brooklyn and Queens. In Q4, renters in the market for amenity-rich units in Manhattan were least likely to find concessions, with 34.8% of listings advertising concessions: lower than Brooklyn (39.7%), Queens (52.1%), and the Bronx (74.5%).
Brooklyn and Queens Will Be the Bedrock of the NYC Rental Market
As competition heats up in Manhattan, renters will increasingly weigh their options in Queens and Brooklyn — one of our housing market predictions for 2025. Inventory has been rising in the outer boroughs, driven by new construction over recent years.
While the number of new building permits declined briefly in 2023 after the 421-a tax abatement expired, the surge of new permits approved before the expiry suggests a steady flow of new construction joining the market over the coming years, particularly across the East River.
As a result, new buildings with sought-after amenities are capturing a larger share of the NYC market. In Q4 2024, 17.8% of the city’s inventory was amenity-rich rentals — the largest share since StreetEasy began collecting data in 2010. In Q4 2023, 14.8% of NYC’s inventory was considered amenity-rich.
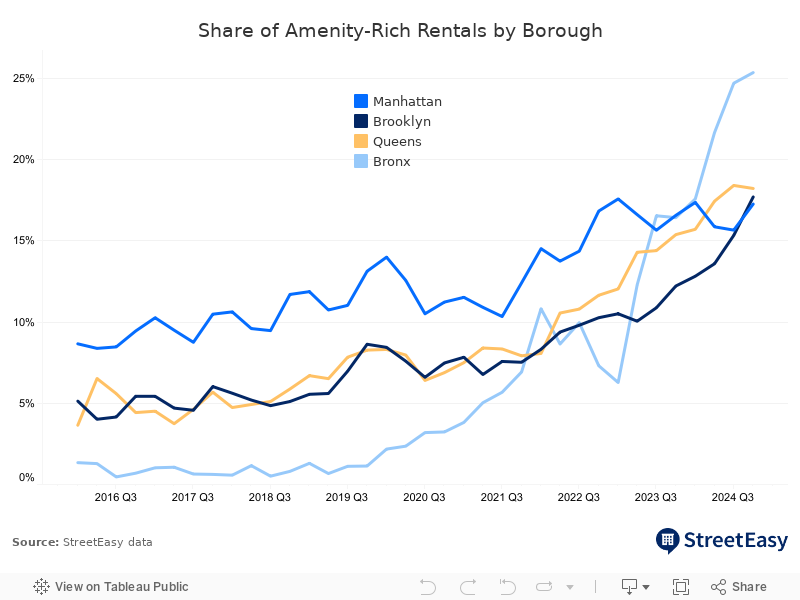
New York’s outer boroughs are ahead of this trend. In Q4, one in four rentals in the Bronx was amenity-rich, the highest share in the city. Queens had the second-highest share, at 18.2%, followed by Brooklyn at 17.7%.
Growing amenity-rich inventory and concessions in the outer boroughs present opportunities for renters. Brooklyn and Queens dominated our recently released list of Neighborhoods to Watch in 2025, which identified 10 neighborhoods with the greatest annual search increases on StreetEasy in 2024. Six of the 10 neighborhoods were in Brooklyn. Three neighborhoods in Queens made the list (a decline from five the previous year), and just one neighborhood in Manhattan took the final spot.
The Growing Popularity of Brooklyn and Queens Reflects Heightened Price Sensitivity
The strong annual growth in searches for homes in the outer boroughs reflects New Yorkers adjusting to the challenging affordability environment. As concerns over affordability mount, NYC renter demand has become more sensitive to prices than before the pandemic. Our analysis shows that in Q4 2024, every 1.0% price differential relative to similar rentals in a neighborhood likely led to a 1.5% reduction in demand on average, proxied by the number of inquiries from renters. This marginal decline in demand captures renters’ price sensitivity.
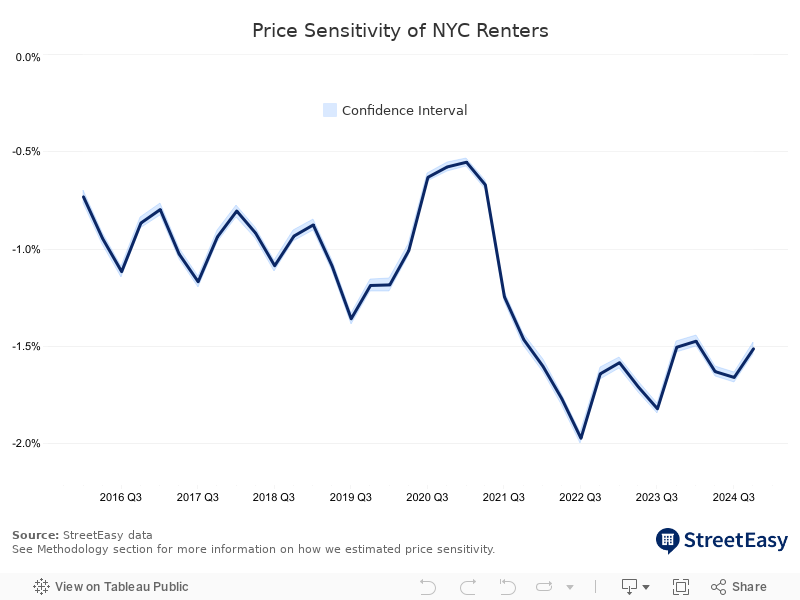
Renters were even more budget-conscious in 2022, as asking rents soared amid scorching-hot competition. In Q3 2022, renter price sensitivity peaked at 2.0%. By contrast, renters were less price-aware during the pandemic: following declining asking rents in late 2020, the price sensitivity figure moderated to 0.6% in Q1 2021.
Soaring rent burdens are likely behind the jump in price sensitivity since the pandemic. The minimum income needed to afford the typical asking rent in NYC has soared 21.6% since December 2019, before the pandemic disrupted the market. As of December 2024, this minimum required income was $141,800: nearly twice the NYC median household income of $76,577, according to the U.S. Census Bureau’s American Community Survey.
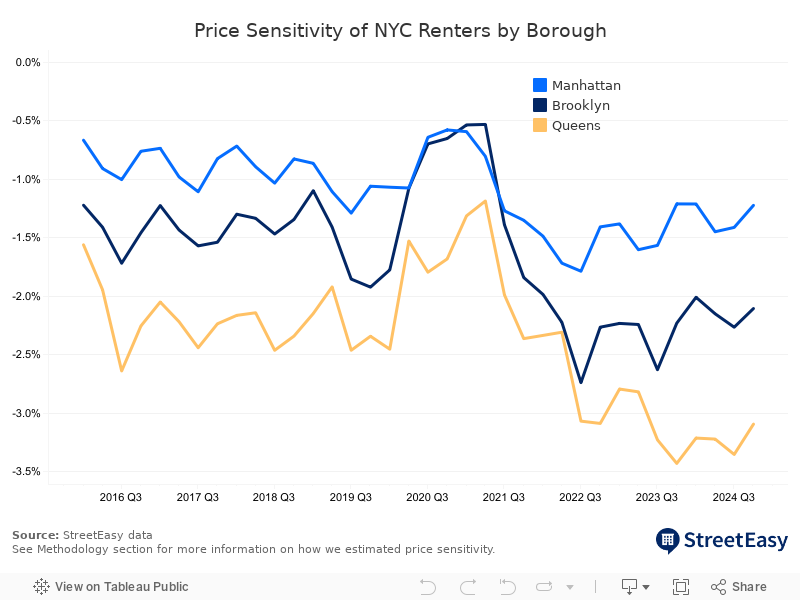
Amid heightened price sensitivity, more budget-conscious renters are weighing their options in the outer boroughs. In Q4 2024, renters in Queens displayed a 3.1% decline in demand for every 1.0% price differential, while their Brooklyn counterparts showed a 2.1% drop. As renters remaining in Manhattan are more likely to have larger budgets, their sensitivity was lower at 1.2%. This varying price sensitivity explains the growing popularity of Brooklyn and Queens, which currently offer more inventory at lower price points than Manhattan.
Renters Prioritized One-Bedrooms Under $4,000 the Most
Even as renters expand their search across New York’s rivers, many popular Manhattan neighborhoods stand the test of time. In 2024, Midtown East, the West Village, and Greenwich Village continued to be among the most-searched rental markets. However, compared to the other boroughs, Manhattan’s most sought-after neighborhoods didn’t offer as many rentals that fit popular search criteria.
For many renters, minimum bedrooms and maximum budget are likely to be the two most important factors during their next home search. In 2024, the most commonly used maximum budget filter for NYC rentals was $4,000, unchanged from 2023 and 14% above the citywide median asking rent of $3,500. Renters looking for studios most often set their maximum budget at $3,000.
The most popular filter for minimum number of bedrooms was one, followed by two in 2024. Nearly half of rental searches in 2024 looked for at least one bedroom, indicating the broad-based popularity of one-bedrooms among renters in NYC. In 2024, the total number of searches for one-bedroom rentals rose 3.8% from 2023, while that of two-bedroom rentals increased 1.4% from 2023.
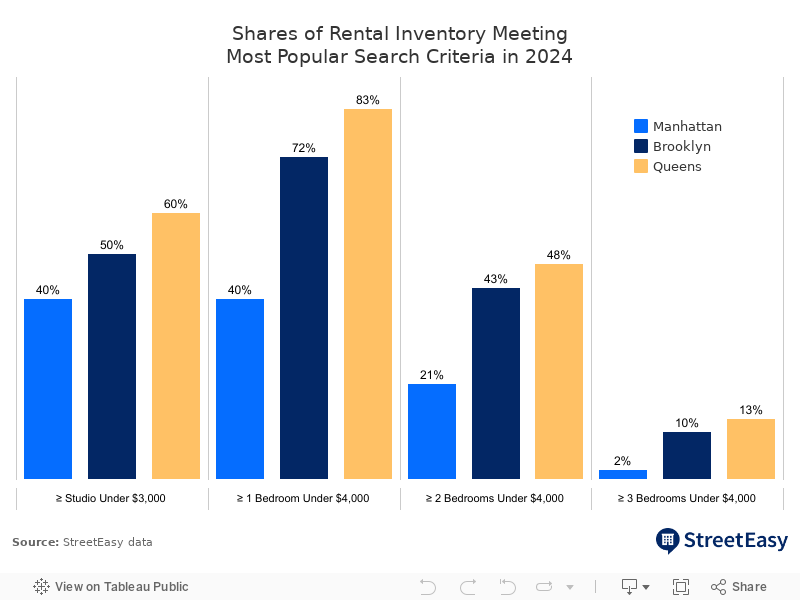
Fewer rentals in Manhattan met these criteria after rapid increases in rents since the pandemic. The most popular combination of minimum bedrooms and maximum budget was one-bedroom rentals under $4,000, accounting for 14.5% of total renter searches in 2024. Just 40.4% of Manhattan’s inventory met these search criteria in 2024, while 72.0% of Brooklyn inventory and 82.7% of Queens inventory did so. In 2023, the share of inventory that met the most popular search criteria at the time was 50.9% in Manhattan, 70.5% in Brooklyn, and 71.8% in Queens. As the availability of homes meeting popular search criteria rises in the outer boroughs, demand will continue to be drawn away from Manhattan.
Methodology
How we estimated renter price sensitivity
We analyzed nearly 2.9 million rental listings that appeared on StreetEasy between 2016 and 2024 to estimate the marginal change in demand in response to price differentials (namely, the price sensitivity or elasticity of demand). We used hedonic regression to account for the differences in physical characteristics of housing, such as number of bedrooms and location. In this analysis, prices are log-transformed asking rents of listings on StreetEasy. Demand is measured as the log-transformed number of inquiries each listing receives from renters. To track changes in price sensitivity over time, the regression model was estimated on a rolling basis across each quarter between 2016 and 2024. On average, nearly 80,000 unique listings per quarter were analyzed.
StreetEasy is an assumed name of Zillow, Inc. which has a real estate brokerage license in all 50 states and D.C. See real estate licenses. StreetEasy does not intend to interfere with any agency agreement you may have with a real estate professional or solicit your business if you are already under contract to purchase or sell property. All data for uncited sources in this presentation has been sourced from Zillow data. Copyright © 2025 by Zillow, Inc. and/or its affiliates. All rights reserved.