Pricing your home is one of the trickiest parts of the selling process. Often, sellers turn to the local expertise of real estate agents to help set the price of their listing. In doing so, sellers aim to maximize their profit or, in some cases, lower the time the home sits on the market.
There are a few useful tools that agents and sellers can turn to for establishing price. One of them is knowing how much of the initial asking price was actually received by homes in your neighborhood. This figure is known as the sale-to-list price ratio. Here’s more on what this ratio means, and why it’s important.
What is the sale-to-list price ratio?
The sale-to-list price ratio is the ratio of a home’s final recorded sale price to its initial asking price. It’s calculated by dividing the final sale price by the initial asking price, and expressed as a percentage. For example, if a seller listed a home for $1 million and it ended up selling for $900,000, the sale-to-list price ratio for that home would be 90%. If a home sells for more than asking, the ratio will be greater than 100% — so, if the same home were instead listed for $900,000 and sold for $1 million, the sale-to-list price ratio would be 111%.
When determining the sale-to-list price ratio of a neighborhood or borough, the median ratio for homes in that neighborhood or borough is used.
What does the sale-to-list price ratio say about the local market?
An area’s sale-to-list price ratio can tell you a lot about the local market, and whether it’s a buyer’s market or seller’s market. A relatively lower ratio compared to other neighborhoods or boroughs may indicate more negotiating power for buyers, whereas a higher ratio indicates greater competition among buyers (and more leverage for sellers). A neighborhood with a sale-to-list price ratio greater than 100% is among the most competitive for buyers. In these markets, buyers may engage in bidding wars, which raises the price above the seller’s initial ask.
How to find sale-to-list price ratio data
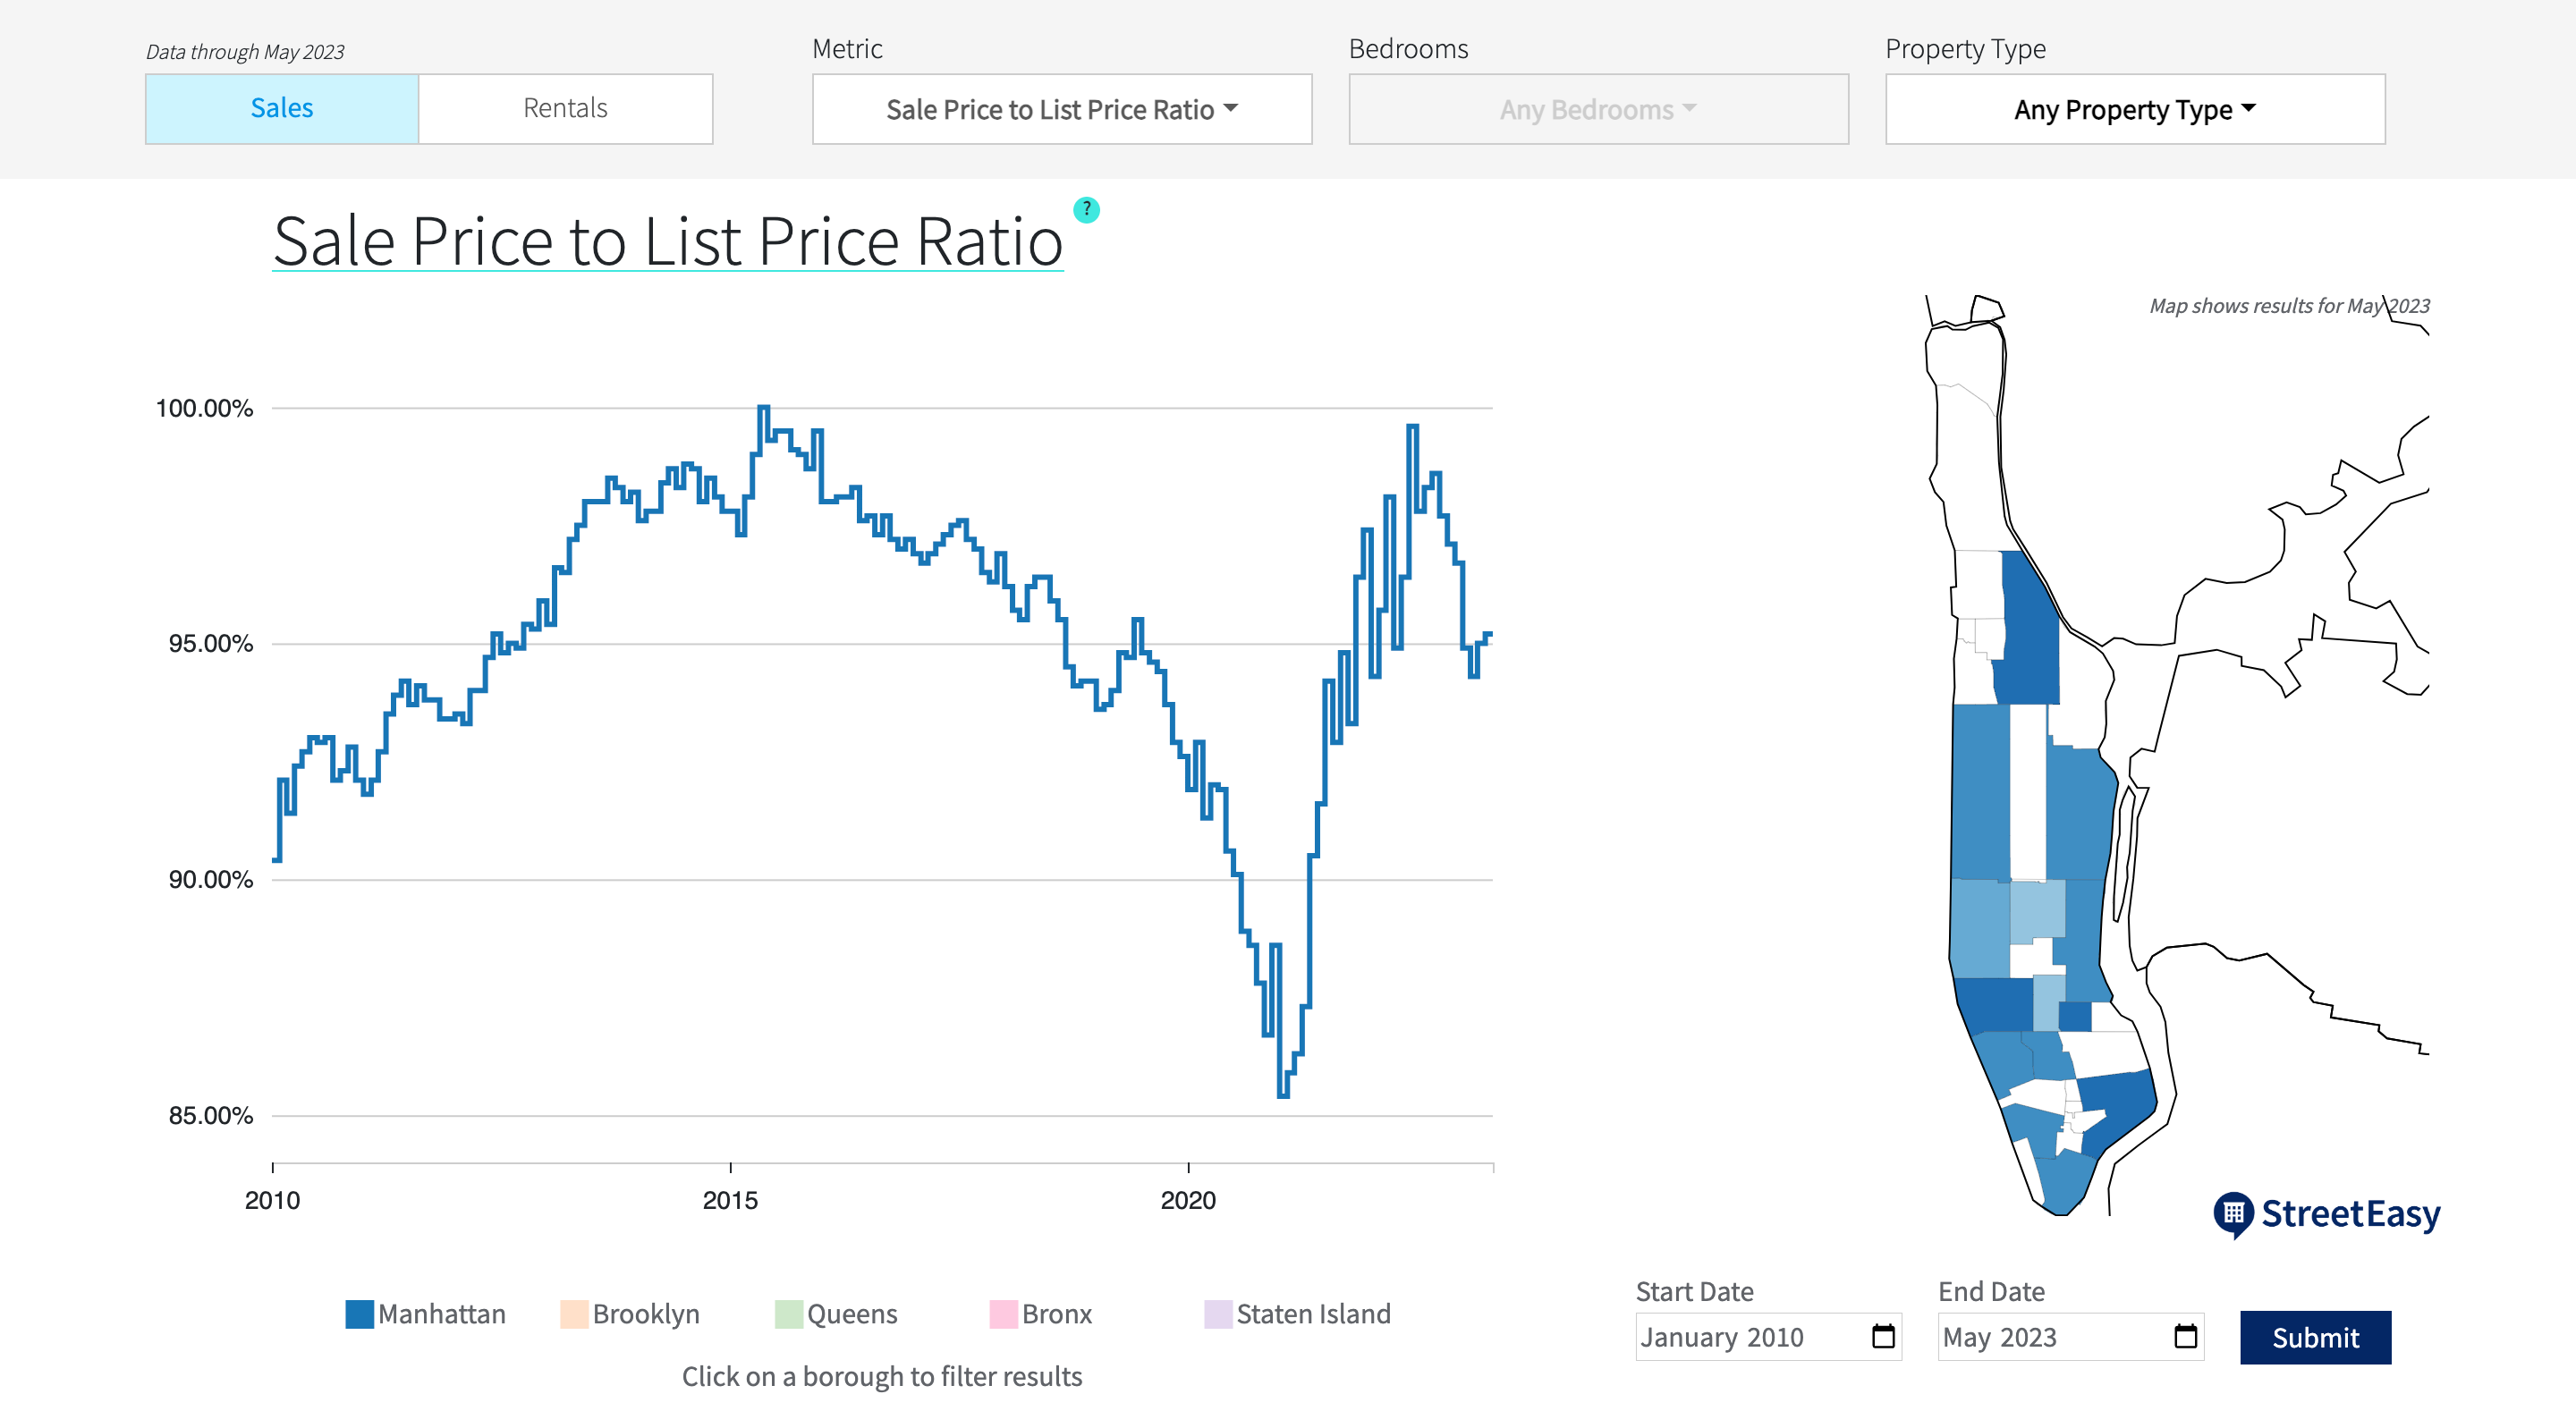
You can use the StreetEasy Data Dashboard to find the sale-to-list price ratio in a given borough, or neighborhood if there is enough data available. Use the graph to see changes in the ratio over time, or within the year — you may notice seasonal trends. Furthermore, you can filter the data by property type: condo, co-op, or single-family home.

Why it’s important when choosing an agent, too
Real estate agents have sale-to-list price ratios as well. An agent’s ratio will be determined by the homes they’ve sold, and the recorded sale prices relative to the asking prices for those homes. So if you’re looking for a listing agent to help sell your home, choosing one with a high sale-to-list price ratio relative to the market is a smart move.
As a seller, you’ll be pleased to learn that top agents in StreetEasy’s Experts Network — made up of NYC agents with hyper-local experience selling homes similar to yours — have a sale-to-list price ratio that is around 10% better than the market.* If you’d like to be connected with a StreetEasy Expert whose deal history and experience best matches your needs, contact our dedicated Concierge for sellers. Or, in the meantime, learn more about selling your home confidently with StreetEasy.
*Source: StreetEasy (2012-2022). Market defined as borough, unit type, price point, and share of listings by year.
Disclaimers: StreetEasy is an assumed name of Zillow, Inc. which has a real estate brokerage license in all 50 states and D.C. See real estate licenses. StreetEasy Concierge team members are real estate licensees, however they are not your agents or providing real estate brokerage services on your behalf. StreetEasy does not intend to interfere with any agency agreement you may have with a real estate professional or solicit your business if you are already under contract to purchase or sell property.
For FSBO postings, the StreetEasy Concierge is meant to provide insight to improve your posting performance on StreetEasy and may refer you to a real estate professional based on your specific needs.


