
Key Takeaways:
- New for-sale listings rose 1.4% year-over-year, indicating NYC sellers are adjusting to elevated mortgage rates.
- In-contract homes increased 1.2% annually to 10,153 — the first annual increase since 2022.
- Asking prices in Manhattan stagnated while continuing to climb in the outer boroughs, signaling buyers retain the greatest negotiating power in Manhattan.
Sellers are finally starting to return to the NYC market after a challenging spring for both buyers and sellers, amid fluctuating and elevated mortgage rates. The average 30-year mortgage rate declined from 7.6% in October 2023 to 6.8% in March 2024, but has since risen again to 7%. Homeowners have been reluctant to trade in for a new home at today’s much higher rates. Across NYC, 30,892 homes were on the market between January and May of this year, 2.8% fewer than last year.
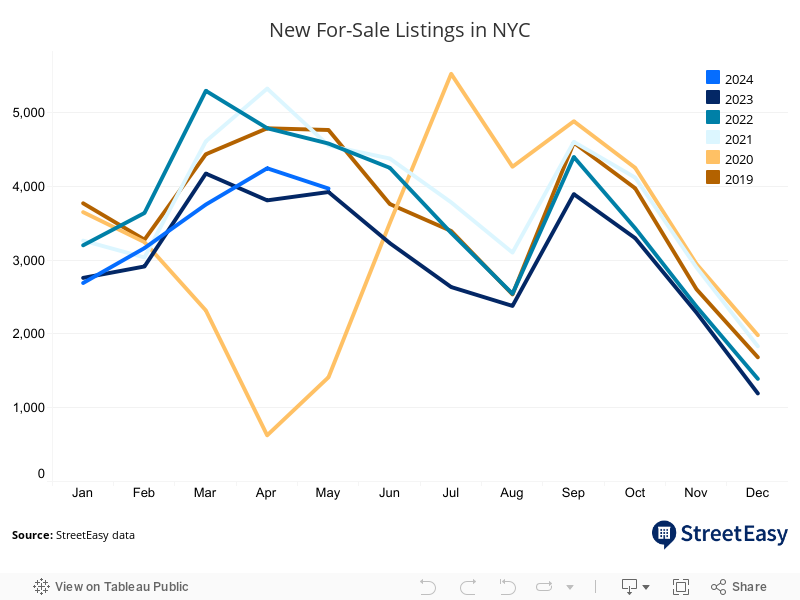
Affordability challenges are keeping many would-be buyers on the sidelines, but home shoppers can expect more options this summer. Between January and May, 17,826 homes entered the NYC market, up 1.4% from last year — the first annual increase since 2022. The increase in new listings suggests homeowners are adjusting to the prospect of persistently elevated mortgage rates, after holding off on selling over the past two years.
More new listings likely helped many buyers unlock their next home. So far this year, 10,153 homes in the city have entered contract, 1.2% more than last year. However, due to the limited overall inventory in NYC, competition for well-priced homes was fierce: 15.4% of homes sold above initial asking, slightly higher than 14.2% a year ago.
Conversely, mispriced listings are languishing on the market, with high mortgage rates leaving little to no room for home shoppers to stretch their budgets. StreetEasy data shows homes that entered contract in May were priced 1.8% below similar listings in the neighborhood on average, and spent a median of just 55 days on the market.1 By comparison, all homes currently for sale in NYC have spent a median of 184 days on the market as of this writing.
Asking Prices Are Leveling Off
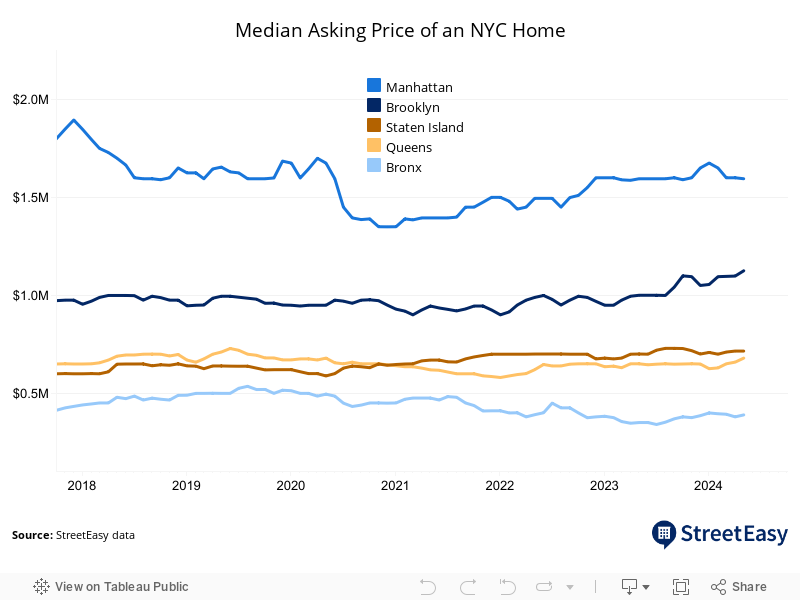
The median asking price in NYC increased 3.7% year-over-year to $1.12M in May — the highest median asking price since spring 2018 — but the current growth rate is much slower than the average growth of 7.5% in spring of last year. However, the citywide median asking price is peaking as buyers, amid cooling competition, continue to regain negotiating power, particularly in Manhattan.
Manhattan Homes Under $1.5M on StreetEasy Article continues below


The median asking price in Manhattan remained flat compared to last year at $1.595M. Meanwhile, the most competitive market with the least room for negotiation remains Brooklyn. The borough’s median asking price reached a new high of $1.125M, 12.5% higher than a year ago. A typical home sold in Brooklyn received 98.4% of its initial asking price in May, higher than any other borough.
In relatively affordable Queens and the Bronx, asking prices are also rising quickly. The median asking price in Queens was $679,000 in May, a 4.5% increase from a year ago. In the Bronx, the median asking price soared 11.1% year-over-year to $389,000 in May.
Buyers Can Find More New Listings in Manhattan and Queens
In Manhattan, 8,862 homes were newly on the market this year, an increase of 2.1% from last year. New listings increased 3% year-over-year to 3,236 units in Queens. Despite fierce competition among buyers in Brooklyn, just 4,757 homes entered the market, a slight 0.1% increase from last year.
Queens Homes Under $1M on StreetEasy Article continues below


Despite gains in new listings, the number of listings overall on the market remains down year-over-year. But, as more new sellers join the market, the drawdown in total inventory — the number of new listings and listings already on the market — is finally slowing. So far this year, the city has seen a 2.8% decline in total inventory, a significant improvement from the 9.8% drop last year.
The recent increases in new listings should help replenish the city’s total inventory this summer. In May, 3,971 homes were newly listed for sale, an increase of 1.2% from a year ago, following a 11.4% jump in April.
Increases in New Listings Led to Rising New Contracts
As fresh listings expanded buyers’ options, more homes entered contract this year. In Manhattan, which saw the strongest gain in new listings, 4,819 homes entered contract this year, 2.6% more than last year. While Brooklyn was the most competitive market in NYC, limited new listings resulted in just 2,913 homes finding buyers, an increase of just 0.6%.
Brooklyn Homes Under $1.5M on StreetEasy Article continues below


In Queens, 1,831 homes entered contract, down 2.3% from a year ago. Slower condo sales in Long Island City dragged down the borough’s new contracts this year, while condo sales in Astoria and Flushing picked up modestly. In Long Island City, 137 condos entered contract this year, 33.5% fewer than the year before.
- Excludes luxury homes defined as the most expensive 10% of the market, and homes that sold at an extreme discount or premium for reasons specific to the home. ↩︎
StreetEasy is an assumed name of Zillow, Inc. which has a real estate brokerage license in all 50 states and D.C. See real estate licenses. StreetEasy does not intend to interfere with any agency agreement you may have with a real estate professional or solicit your business if you are already under contract to purchase or sell property. All data for uncited sources in this presentation has been sourced from Zillow data. Copyright © 2024 by Zillow, Inc. and/or its affiliates. All rights reserved.