
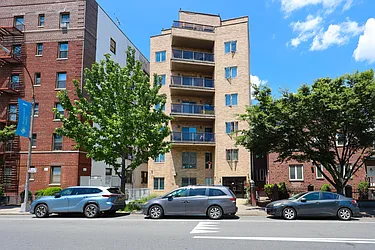
StreetEasy’s August 2020 Market Reports reveal a spike in pending home sales across Brooklyn, defying trends in other boroughs. (Getty Images)
A near-record number of Brooklyn homes went into contract in August, even as pending sales in Manhattan and Queens continued to fall amid a market slowdown, according to StreetEasy’s August 2020 Market Reports.
Pending sales in Brooklyn increased 38.7% from last year, with 735 homes going into contract — 205 more than last year. The only time pending sales were higher in the borough was in March 2019, when 748 homes entered contract.
Brooklyn was the clear outlier of all boroughs analyzed. In Manhattan and Queens, the number of homes that went into contract fell by 6.0% and 4.3%, respectively. Still, the surge in Brooklyn sales shows that New Yorkers continue to be interested in buying homes, and that some market segments remain highly competitive.
Pending sales in Brooklyn increased across nearly all five price tiers:
- Pending sales in Brooklyn’s lowest tier, where the median price is $253,000, increased by 100% over 2019.
- Pending sales of homes in the second-highest tier, with a median price of $999,614, rose 65% over last year.
- The only tier that did not see much change was the uppermost or luxury tier, with a median of $1,613,856, where pending sales fell 0.7%.
The increase in Brooklyn sales activity was not driven solely by homes at one price point or location. Sales increased in more affordable neighborhoods like Bay Ridge and Flatbush, as well as in pricier areas like Downtown Brooklyn and Prospect Park.
In fact, the Prospect Park [i] submarket saw the largest year-over-year increase in pending sales in the entire city. In August, 111 homes there went into contract, more than double (117%) what the submarket saw last year. Prices also rose in Prospect Park — up 3.0% to $1,295,000, in the largest year-over-year jump in the borough.
“The striking surge in new deals in Brooklyn is the one of the first optimistic indicators for the city’s sales market, and suggests that contrary to popular belief, many are making the commitment to live in the city for the long term,” says StreetEasy Economist Nancy Wu.
Brooklyn 1-2BRs Under $750K on StreetEasy Article continues below


“Manhattan has been much slower to bounce back — which indicates that buyers looking to take advantage of the low mortgage rates and stay in the city are prioritizing space and affordability over living close to their offices,” Wu says. “All else being equal, Brooklyn homes provide more bang for a homebuyer’s buck than Manhattan homes.”
Manhattan Had the Most Inventory in Over a Decade
Total sales inventory in Manhattan rose 24% over last year, with 10,639 homes on the market — the highest number in more than a decade. While supply increased, prices dropped, and so did the number of homes that went into contract.
The StreetEasy Manhattan Price Index [ii] fell 4.5% to $1,395,000, its lowest level since July 2014. Even with prices dropping, the number of homes entering contract was still down 6.0% from last year.
Brooklyn Prices Stayed Flat as Inventory Rose
The StreetEasy Brooklyn Price Index stayed flat compared to last year at $956,900. Prices did drop in North Brooklyn [iii], the borough’s most expensive submarket, by 3.9% to $1,410,000.
NYC 1-3BRs for Rent Under $2,700 on StreetEasy Article continues below


Sales inventory in the borough was at near-record high levels with 5,830 homes on the market — an increase of 6.6% compared to last year. Inventory had not been as high since October 2019.
Prices Rose in Queens’s Most Expensive Areas
Prices rose in Northwest [iv] and Northeast [v] Queens, the borough’s two most expensive submarkets, by 3.5% and 3.4% respectively. However, the StreetEasy Queens Price Index remained flat at $660,000.
The August 2020 market reports found that sales inventory continued to linger in these expensive areas — particularly in Northwest Queens, where inventory was up 24.7% year-over-year, to a record high of 601 available homes. The number of homes that entered contract ticked up from the lows seen earlier this spring, but was still down 4.3% compared to last year.
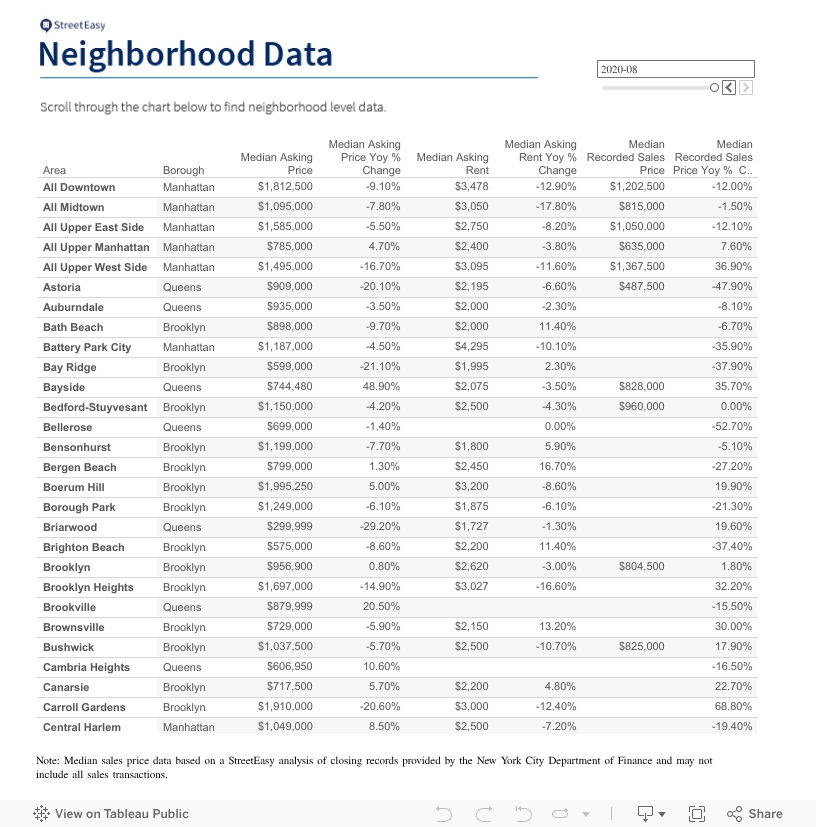
View all StreetEasy Market Reports for Manhattan, Brooklyn, and Queens, with additional neighborhood data and graphics. Definitions of StreetEasy’s metrics and monthly data from each report can be explored and downloaded via the StreetEasy Data Dashboard.
[i] The Prospect Park submarket includes Park Slope, Prospect Heights, Prospect Lefferts Gardens, Prospect Park South, and Windsor Terrace.
[ii] The StreetEasy Price Indices track changes in resale prices of condo, co-op, and townhouse units. Each index uses a repeat-sales method of comparing the sales prices of the same properties since January 1995 in Manhattan and January 2007 in Brooklyn and Queens. Given this methodology, each index accurately captures the change in home prices by controlling for the varying composition of homes sold in a given month. Levels of the StreetEasy Price Indices reflect average values of homes on the market. Data on the sale of homes is sourced from the New York City Department of Finance. Full methodology here.
[iii] The North Brooklyn submarket includes Greenpoint and Williamsburg.
[iv] The Northwest Queens submarket includes Astoria, Long Island City and Sunnyside.
[v] The Northeast Queens submarket includes Auburndale, Bayside, Bellerose, Flushing, Kew Gardens, Little Neck and Whitestone.
—
Whether you’re looking to rent or to buy, find your next NYC apartment on StreetEasy.