
Manhattan home prices declined in November, giving buyers a stronger hand. (Alexander Spatari / Getty Images)
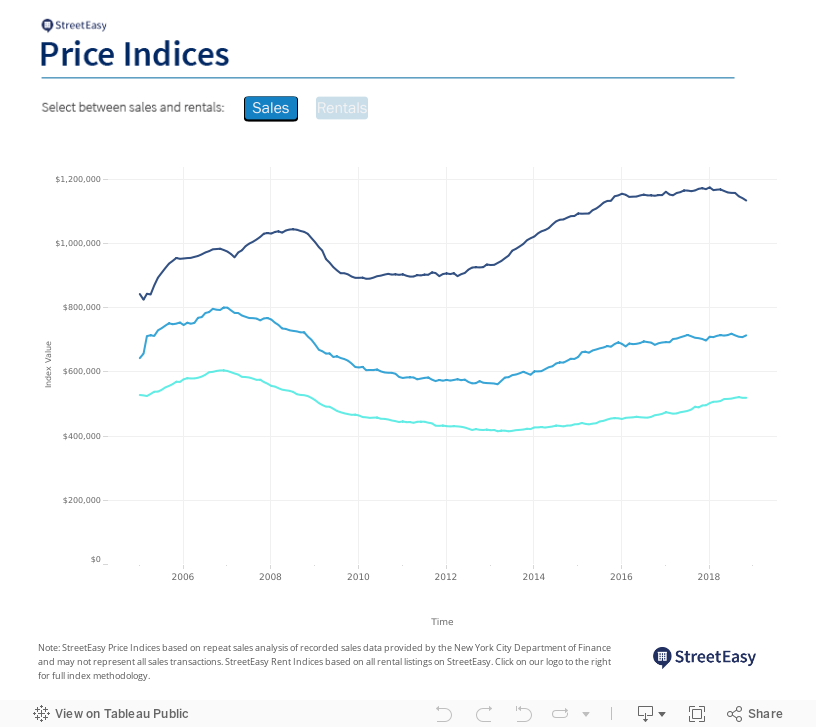
The New York City sales market shifted further in favor of buyers this November, particularly in Manhattan, according to StreetEasy’s November 2018 Market Reports [i]. The StreetEasy Manhattan Price Index [ii] fell 3.3 percent from the prior year, down to $1,133,988 — nearly the same level as in October 2015. Sales inventory remained high, with 18 percent more homes on the market than this time last year, though inventory levels were down slightly from their October 2018 peak.
With falling prices, the number of home sales [iii] rose slightly in Manhattan. There were 2.8 percent more homes sold in November than the same time last year, a sign of confidence for prospective Manhattan sellers. The number of home sales rose by 10.5 percent in Queens and stagnated in Brooklyn, despite prices rising in both boroughs. The StreetEasy Price Index rose 1.6 percent in Brooklyn, to $713,729, and 4.8 percent in Queens, to $519,344.
“The combination of a ton of new homes on the market and potential buyers holding out for better deals has shifted the market dynamic in Manhattan further in favor of buyers,” says StreetEasy Senior Economist Grant Long. “The modest increase in the number of sales should come as encouraging news to those looking to sell their homes, but it’s too early to tell whether this will be an enduring trend. The majority of sellers are still struggling to get their homes noticed.”
“It’s not just sellers who are put in a tough spot this season,” Long says. “We’ve already started to see the rental market shift over the last few months. While rent increases typically slow this time of year, they’re continuing to rise across Manhattan, Brooklyn and Queens, as more buyers get cold feet and decide to remain as renters. That’s putting even more pressure on the city’s already-burdened rental market.”
November 2018 Key Findings — Manhattan
- Prices dropped at the fastest pace since the financial crisis. Home prices fell 3.3 percent from the prior year to $1,133,988. Homes in the luxury tier (the top 20 percent of the market) fell 3.6 percent in price, down to $4,063,872.
- The number of recorded sales rose. The number of home sales increased 2.8 percent from last year, with 960 Manhattan homes sold in November.
- There were 1,400 more homes on the market than last year. Total sales inventory rose 18.1 percent annually in the borough — one of the largest increases since the financial crisis, second only to October 2018.
- Rents rose across the borough. The StreetEasy Manhattan Rent Index [iv] reached $3,216 — up 2.4 percent over last year. Rents rose in all five Manhattan submarkets, led by Upper Manhattan, where rents increased 2.4 percent to $2,376.
- Concessions were harder to find. The share of rentals advertising concessions [v] was down by 7.7 percentage points in Manhattan since last year. Some 14.7 percent of homes in the borough were offering a concession in November.
November 2018 Key Findings — Brooklyn
- Northwest Brooklyn led the borough in price growth. Prices in Northwest Brooklyn [vi] rose 4.3 percent annually to $1,100,019 — nearly surpassing North Brooklyn [vii] as the borough’s most expensive submarket. The overall StreetEasy Brooklyn Price Index rose 1.6 percent to $713,729.
- Inventory continued to rise. There were nearly 1,000 more homes on the market in Brooklyn than at this time last year. Total inventory rose 20.7 percent across the borough, but fell slightly from the all-time high in October.
- More sellers lowered their price. Price cuts were easier to find in November than a year prior, with the share of sales with price cuts increasing in all five Brooklyn submarkets. Overall, the share of homes with price cuts increased 4.6 percentage points to 12.9 percent.
- North Brooklyn rents dipped to 2015 levels ahead of the L train shutdown. The StreetEasy North Brooklyn Rent Index dropped 1.1 percent from last year to $3,054, its lowest level since June 2015. Boroughwide, rents rose 1.7 percent, reaching $2,596.
- Concessions were hardest to find in Brooklyn. The share of rentals with concessions dipped 9.7 percentage points to 9.2 percent in Brooklyn, making it the borough with the smallest share of concessions.
November 2018 Key Findings — Queens
- Prices rose steadily across the borough. The StreetEasy Queens Price Index rose 4.8 percent to $519,344 in Queens. Prices rose in all five submarkets, led by Central Queens, which saw a 6.7 percent increase in prices to $533,812.
- Sales in Northwest Queens increased significantly. In reaction to Amazon’s HQ2 announcement, the number of recorded sales in Northwest Queens [viii] — which includes Long Island City — rose 23 percent over last year to the highest levels since February. Boroughwide, the number of recorded sales increased 10.5 percent.
- The number of homes on the market nearly matched October’s all-time high. Total sales inventory rose 35.1 percent from last year in Queens. All submarkets saw an increase of more than 25 percent.
- Rents rose slightly. The StreetEasy Queens Rent Index reached $2,165 — up 1.8 percent, or $37, from last year. Rents in Northwest Queens, the borough’s most expensive submarket, increased the most: up 1.1 percent to $2,252.
- The share of rentals offering concessions decreased. The share of rentals advertising concessions dropped 6.8 percentage points to 9.9 percent in the borough — the lowest level since July 2017.
[i] The StreetEasy Market Reports are a monthly overview of the Manhattan, Brooklyn and Queens sales and rental markets. Every three months, a quarterly analysis is published. The report data is aggregated from public recorded sales and listings data from real estate brokerages that provide comprehensive coverage of Manhattan, Brooklyn and Queens, with more than a decade of history for most metrics. The reports are compiled by the StreetEasy Research team. For more information, visit https://streeteasy.com/blog/research/market-reports/. StreetEasy tracks data for all five boroughs within New York City, but currently only produces reports for Manhattan, Brooklyn and Queens.
[ii] The StreetEasy Price Indices track changes in resale prices of condo, co-op, and townhouse units. Each index uses a repeat-sales method of comparing the sales prices of the same properties since January 1995 in Manhattan and January 2007 in Brooklyn and Queens. Given this methodology, each index accurately captures the change in home prices by controlling for the varying composition of homes sold in a given month. Levels of the StreetEasy Price Indices reflect average values of homes on the market. Data on the sale of homes is sourced from the New York City Department of Finance. Full methodology here.
[iii] Recorded sales are projected for the period based upon 1) data received from the New York City Department of Finance through the final day of the period and 2) historical seasonal trends.
[iv] The StreetEasy Rent Indices are monthly indices that track changes in rent for all housing types and are currently available from January 2007 in Manhattan, January 2010 in Brooklyn, and January 2012 in Queens. Each index uses a repeat-sales method similar that used to calculate the StreetEasy Price Indices. The repeat method evaluates rental price growth based on homes in a given geography that have listed for rent more than once. More details on methodology here.
[v] Concessions are defined as advertised, temporary price reductions in the form of one or more months of free rent. StreetEasy does not include non-traditional concessions, such as Netflix packages and discounted amenities. We also do not include the waiving of broker’s fees as concessions.
[vi] The Northwest Brooklyn submarket includes Boerum Hill, Brooklyn Heights, Carroll Gardens, Clinton Hill, Cobble Hill, Columbia St. Waterfront, Downtown Brooklyn, DUMBO, Fort Greene, Gowanus and Red Hook
[vii] The North Brooklyn submarket includes Greenpoint and Williamsburg.
[viii] The Northwest Queens submarket includes Astoria, Long Island City and Sunnyside.
—
Hey, why not like StreetEasy on Facebook and follow @streeteasy on Instagram?