July 2026 NYC housing market report
Key takeaways:
NYC rental market
- Families in NYC have been navigating high rent burdens for more than a decade, with 53.4% of families with children spending more than 30% of their annual income on rent in 2024, compared to 55.2% in 2007 and 52.6% in 2019.
- Recently, the city’s decades-long housing shortage has made it more challenging to search for a new home, with inventory of multiple-bedroom homes down 6.8% from a year ago and 37.9% from 2019.
- Amid high competition, the annual rent would be $57,000 for two-bedroom rentals and $60,000 for rentals with at least three bedrooms, based on median asking rents in July — equivalent to 64.1% and 74.2% of the median annual income for NYC families with children.
NYC sales market
- Sales market activity remained resilient in July despite higher mortgage rates, with contract signings up 16.7% year-over-year.
- Homes entering contract spent five fewer days on market than in July of last year, with Manhattan posting an 11-day decline.
- Sellers maintained their edge with homes selling for a median of 98.3% of their latest asking price, an increase of 0.3pp from July of last year.

Rising housing costs in NYC have been putting pressure on families, as 53.4% of families with children under the age of 18 spent more than 30% of their income on rent in 2024, according to StreetEasy analysis of the U.S. Census Bureau’s American Community Survey (ACS) microdata.
Families are defined as households of two or more people related by birth, marriage, or adoption who live in the same home, following the Census Bureau’s definition. Rent expenses above 30% of pre-tax annual income — a widely accepted definition of “rent burden” used by policymakers and industry experts — leave less room in a household’s budget for other essentials, let alone savings. In 2024, 45.6% of all NYC families spent more than 30% of their annual income on rent in 2024.
While rising incomes in NYC lowered the rent burden in 2024, families with children have been enduring especially high rent burdens for more than a decade. In the wake of the Great Recession, stagnating incomes amid rising rents led to sharp increases in the share of rent-burdened families with children. By 2014, the share had increased to 60.5% from 55.2% in 2007. While this share declined between 2014 and 2019, the improvement was cut short by soaring rents since the pandemic.

Nationwide, 54.1% of families with children were rent-burdened in 2024, slightly higher than 53.4% in NYC, a Zillow report shows. The highest shares were concentrated in high-cost coastal metros with limited supplies of multi-bedroom rentals. Orlando led the nation, where 68.8% of families with children were rent-burdened, followed by Miami (67.0%), New Orleans (66.4%), Jacksonville (63.6%), and Tampa (63.4%).
Despite the high rent burden, many New Yorkers managed to raise families in rental homes. In 2024, 66.7% of NYC families with children were renters, more than double the 31.7% nationwide. The latest NYC share is higher than 63.9% in 2007 before the Great Recession, but about the same as 66.6% in 2019 before the pandemic.
What has changed since the pandemic, however, is that the search for a new home has gotten more challenging. Families seeking a new place are facing a growing shortage of NYC rentals with multiple bedrooms. In July, there were 7,748 two-bedroom rentals across the city, about the same as a year ago, while the number of rentals with three or more bedrooms fell 19.8% to 3,299 units. Together, apartments with at least two bedrooms made up 43.3% of NYC’s 25,523 rentals on the market in July. This was below 45.1% in July 2025, and 49.6% before the pandemic in July 2019.

As competition remained high, asking rents for multi-bedroom rentals have soared. The median asking rent for two-bedroom rentals increased 5.6% year-over-year to $4,750 in July, while the median for units with at least three bedrooms rose 3.9% to $5,500. At these levels, renters earning the median annual income for NYC families with children of $88,937 would spend 64.1% of their income on a two-bedroom apartment. A rental with at least three bedrooms would consume 74.2% of their income.
Some neighborhoods had more multi-bedroom options than others. With 1,383 rentals with at least two bedrooms in July, Bushwick had the most options for renters looking for additional space, followed by Bedford-Stuyvesant with 1,170 units. While Williamsburg had 1,147 multi-bedroom rentals, they come at higher costs: $63,600 annually for two-bedroom units and $84,000 annually for units with three or more bedrooms. By comparison, the median annual rent for the borough was $50,400 for two-bedroom units, and $56,340 for those with at least three.
Neighborhoods with highest inventory of multiple-bedroom rentals in July 2026
Neighborhood | Borough | 2-bed inventory | 3+ bed inventory | 2-bed median annual rent | 3+ bed median annual rent |
|---|---|---|---|---|---|
| Bushwick | Brooklyn | 697 | 686 | $44,388 | $51,000 |
| Bedford-Stuyvesant | Brooklyn | 617 | 553 | $43,200 | $53,988 |
| Williamsburg | Brooklyn | 794 | 353 | $63,600 | $84,000 |
| Upper West Side | Manhattan | 502 | 346 | $79,800 | $96,000 |
| Upper East Side | Manhattan | 500 | 272 | $67,200 | $155,940 |
| Crown Heights | Brooklyn | 408 | 265 | $48,000 | $53,940 |
| Midtown East | Manhattan | 430 | 217 | $80,940 | $108,000 |
| East Village | Manhattan | 401 | 227 | $68,100 | $96,000 |
| Astoria | Queens | 401 | 177 | $49,140 | $53,940 |
| Midtown West | Manhattan | 387 | 154 | $81,300 | $90,000 |
| Flatbush | Brooklyn | 363 | 131 | $39,600 | $45,600 |
| Central Harlem | Manhattan | 238 | 170 | $45,600 | $55,140 |
| Long Island City | Queens | 332 | 76 | $78,000 | $94,116 |
| Greenpoint | Brooklyn | 225 | 114 | $66,000 | $81,600 |
| Lower East Side | Manhattan | 212 | 105 | $65,940 | $93,540 |
| Chelsea | Manhattan | 178 | 99 | $100,740 | $131,940 |
| Downtown Brooklyn | Brooklyn | 230 | 38 | $73,740 | $95,976 |
| Mott Haven | Bronx | 246 | 16 | $44,400 | $44,952 |
| Park Slope | Brooklyn | 141 | 117 | $60,000 | $79,800 |
| East Harlem | Manhattan | 133 | 100 | $42,000 | $51,540 |
While the Upper West Side and Upper East Side had the highest inventory of multi-bedroom rentals in Manhattan, their annual costs were much higher than the rest of the city. Rentals on the Upper West Side and Upper East Side with at least three bedrooms were often luxury units, with a median annual rent of $96,000 and $155,940 respectively.
The lofty asking rents for larger apartments in Manhattan primarily reflect high demand relative to availability. Manhattan, where the shortage of available rentals is the most severe in NYC, was the most competitive borough for renters in July, with its median asking rent rising 5.2% year-over-year to $4,995. Median asking rents increased across all rental sizes in Manhattan, reaching $3,800 for studios (up 5.6%), $4,820 for one-bedrooms (up 5.9%), $6,000 for two-bedrooms (up 7.1%), and $8,000 for rentals with three or more bedrooms (up 3.2%).
NYC rentals under $3,500 on StreetEasy Article continues below
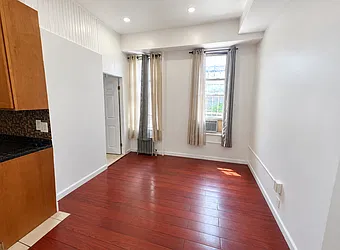
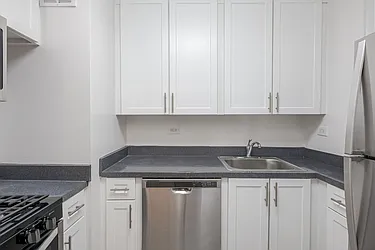
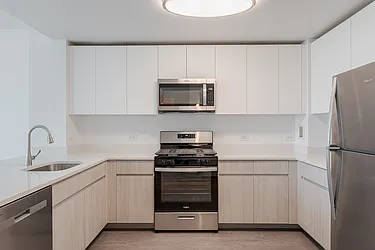
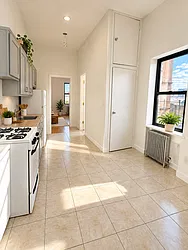
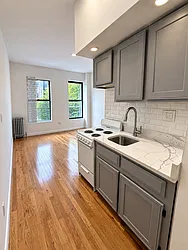

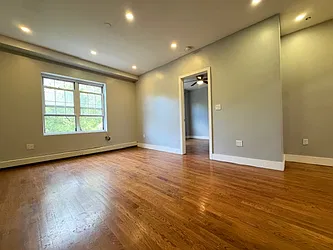
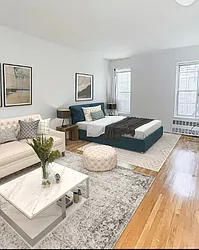
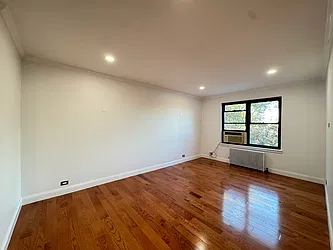
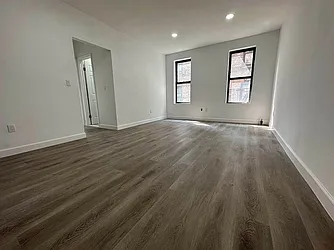
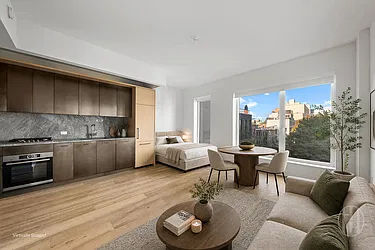
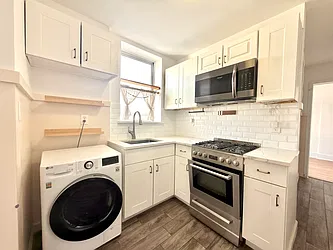
Ultimately, the city’s housing shortage impacts everyone, including non-family households — such as individuals living alone or sharing an apartment with roommates. The NYC metro area still faced a 400,000-unit housing deficit in 2024 due to a decades-long undersupply of new housing. As a result, the rental market remained hot, with the citywide median asking rent rising 2.8% year-over-year to $4,200 in July. Smaller apartments also experienced strong demand, with the median asking rent rising 2.9% to $3,500 for studios and 3.0% to $3,995 for one-bedrooms.
Allowing additional flexibility in zoning would help close the city’s staggering housing deficit and slow down the pace of rent growth. Expanding mixed-use districts to allow apartments and offices to coexist would create more housing opportunities close to economic opportunities. Relaxing caps on the ratio of building floor space to lot size (also known as Floor Area Ratio or FAR) can help remove design constraints that favor smaller units in high-demand areas. Moreover, streamlining the permitting process for new buildings would help the city catch up with pent-up demand.
The sales market moved faster despite higher mortgage rates
StreetEasy data indicates a hot sales market continued this summer. In July, 2,147 homes entered contract across the city, up 16.7% from a year ago. As strong contract activity continued, inventory fell 1.6% year-over-year to 17,236. However, mortgage rates continued to rise, eroding the improvement in affordability earlier this year. The recent increases could keep some buyers on the fence.
Despite the challenges ahead, gradual declines in asking prices have put more homes within reach for buyers while helping sellers maintain their edge. The citywide median asking price slipped 5.0% from a year ago to $998,000 in July, and homes sold for a median of 98.3% of their most recent asking price, an increase of 0.3pp from July last year.
NYC homes under $1M on StreetEasy Article continues below
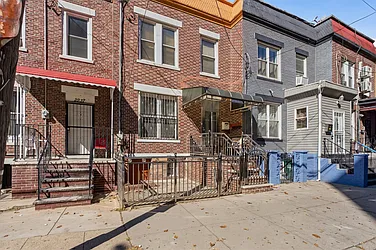
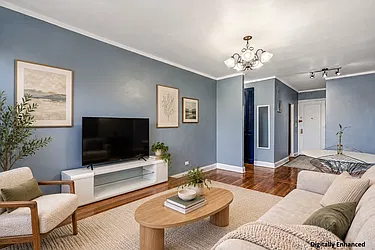
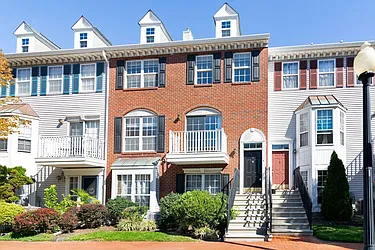
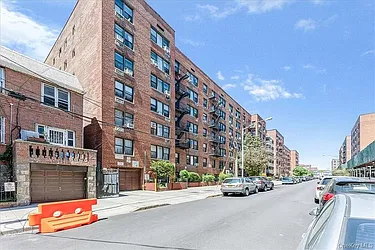
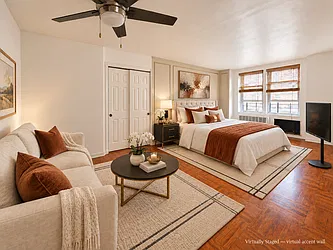
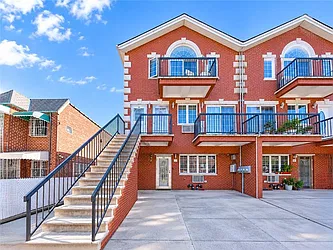
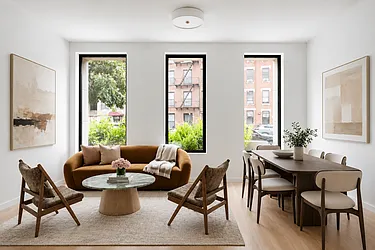
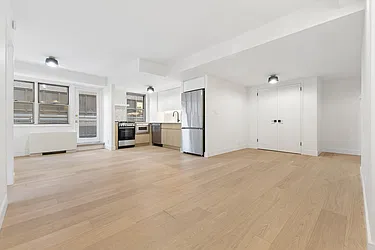
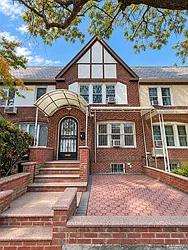
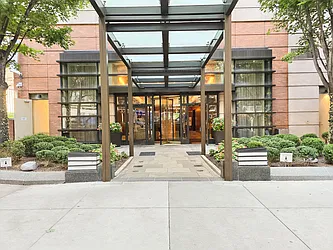
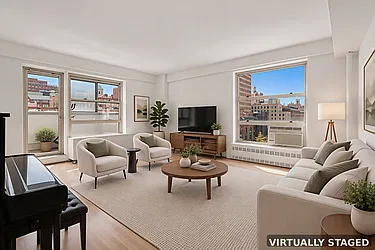
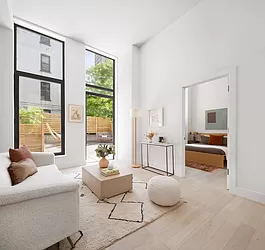
Manhattan sales activity continued to show strength in July as 984 homes in the borough entered contract, up 11.1% from a year ago. Homes that sold received a median of 98.1% of their latest asking price, a solid increase of 0.4pp. The luxury segment has been particularly strong, leading the sales momentum particularly in Manhattan. Brooklyn and Queens also saw strong growth in homes entering contract, with 16.8% and 28.8% increases respectively.
As buyers and sellers return to the market, homes are selling faster than they did last summer. Homes that entered contract in July spent a median of 67 days on the market, five fewer than a year ago. Manhattan saw the largest improvement, with median days on market falling by 11, followed by Brooklyn with an 8-day decline.
NYC market data: July 2026
Sales
 NYC |
 Manhattan |
 Brooklyn |
 Queens | |
|---|---|---|---|---|
| Median asking price | $998,000 (-5.0% YoY) | $1,350,000 (-3.6%) | $1,049,000 (-4.6%) | $694,000 (+0.1%) |
| Number of homes for sale | 17,236 (-1.6%) | 8,357 (-5.0%) | 4,412 (+2.3%) | 3,435 (+9.0%) |
| Homes entering contract | 2,147 (+16.7%) | 984 (+11.1%) | 577 (+16.8%) | 456 (+28.8%) |
| Median days on market | 67 (-5) | 78 (-11) | 55 (-8) | 62 (+2) |
Rentals
|
NYC |
Manhattan |
Brooklyn |
Queens | |
|---|---|---|---|---|
| Median asking rent | $4,200 (+2.8% YoY) | $4,995 (+5.2%) | $3,990 (+5.0%) | $3,400 (+0.7%) |
| Number of homes for rent | 37,172 (-4.0%) | 17,026 (-8.1%) | 14,147 (-2.0%) | 4,853 (+4.1%) |
| Share of rentals with price cuts | 14.3% (-2.2pp) | 17.2% (-1.9pp) | 12.5% (-2.6pp) | 10.9% (-1.7pp) |
| Share of rentals offering concessions* | 14.4% (+0.1pp) | 11.2% (+0.2pp) | 14.9% (-0.5pp) | 18.3% (-0.8pp) |
Thinking about buying in NYC? Chat with our complimentary, licensed Concierge to learn about the buying process.
StreetEasy is an assumed name of Zillow, Inc. which has a real estate brokerage license in all 50 states and D.C. See real estate licenses. StreetEasy does not intend to interfere with any agency agreement you may have with a real estate professional or solicit your business if you are already under contract to purchase or sell property. All data for uncited sources in this presentation has been sourced from Zillow data. Copyright © 2026 by Zillow, Inc. and/or its affiliates. All rights reserved.