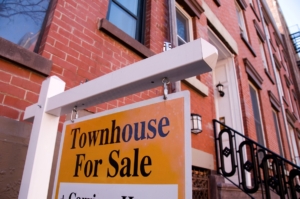
June 2026 NYC housing market report
Key takeaways:
NYC sales market
- NYC’s sales market stayed hot in June, with homes entering contract up 18.6% and new listings up 13.1% from a year ago.
- Contract volume rose for all price tiers, but the top third of the market outperformed with new contracts up 29.2%.
- Within the luxury tier, defined as the most expensive 10% of the NYC market, resale condos were the busiest segment with rising inventory and homes entering contract.
- Luxury sponsor condos, the priciest segment on a per-square-foot basis at $2,979, remained under pressure from rising resale inventory.
- Luxury co-ops saw increased contract volume, but inventory remained mostly limited to five prestigious addresses representing $1.7T in total market value.
- Luxury townhouses saw the highest number of new contracts since 2010, as demand has been growing substantially since the pandemic.
NYC rental market
- The citywide median asking rent increased 5.0% from a year ago to $4,200 in June, the highest on StreetEasy record since 2010.
- Brooklyn was the only borough with a noticeable increase in rental inventory, rising 2.2% from a year ago.
- With abundant new developments in the borough, 17.0% of rentals in Queens offered at least one month of free rent as concessions in June, higher than in Manhattan and Brooklyn.

NYC sales market
The sales market remained hot in June, beyond the seasonal slowdown following Memorial Day. Across New York City, 2,349 homes entered contract, up 18.6% from a year ago. Sellers looking to capitalize on strong demand jumped into the market. In June, new listings increased 13.1% year-over-year to 3,473 units, but as new contracts outpaced new listings, inventory fell 0.4% to 18,124 units.
Gradually improving affordability has been supporting sales activity. While mortgage rates remained elevated, the average rate in June was slightly lower than a year ago. Moreover, asking prices have been declining from last year as sellers have met buyers halfway. In June, the citywide median asking price fell 9.1% year-over-year to $1M.
While contract activity was strong across all price points, more expensive segments of the market outperformed the rest. The most expensive third of the NYC market by asking price saw a 29.2% year-over-year jump in new contracts, while the middle and bottom thirds experienced 16.1% and 12.6% increases, respectively.

In particular, the luxury tier, defined as the most expensive 10% of inventory, continued to see strong contract activity. The starting price of the luxury tier was $4.2M in June, 3.4% below a year ago. Across the city, 144 homes priced above this threshold entered contract in June, rising 17.1% from a year ago, extending an unbroken streak of annual increases since July 2024.
More competitive pricing and fresh new listings are likely the primary drivers of strong luxury market activity. The median asking price of the most expensive 10% (effectively the 95th percentile of asking prices) declined 1.4% year-over-year to $6.9M, and new luxury listings increased 59.4% to 263 units in June.

Luxury properties are concentrated on the Upper East Side and in Midtown. Park Avenue, spanning from the Harlem River to Union Square, was the most valuable street for luxury homes on the market in June. The Upper East Side portion of Park Avenue had 86 luxury listings with a total value of $833M by asking price. Combined with the 24 units on the Midtown side of Park Avenue, the total value of luxury homes on the market was $1.4T.
Central Park South, a three-block stretch of 59th Street in Midtown, was the second most valuable street in June with a combined value of $814M. Though Central Park South is much shorter than Park Avenue, units on Central Park South had higher asking prices, placing the street in the second-highest spot in terms of total value.
Most valuable NYC streets for luxury homes on the market in June 2026
| Street | Neighborhood | Median asking price | Total value | Inventory |
|---|---|---|---|---|
| Park Avenue | Upper East Side | $7,125,000 | $832,833,000 | 86 |
| Central Park South | Midtown | $9,441,500 | $814,489,999 | 48 |
| West 57th Street | Midtown | $13,000,000 | $811,157,999 | 36 |
| Fifth Avenue | Upper East Side | $8,995,000 | $794,245,000 | 64 |
| Park Avenue | Midtown | $15,937,500 | $601,700,000 | 24 |
| Central Park West | Upper West Side | $7,975,000 | $448,840,000 | 38 |
| West 53rd Street | Midtown | $8,680,820 | $347,770,016 | 26 |
| West 66th Street | Upper West Side | $16,900,000 | $340,780,000 | 15 |
| West 18th Street | Chelsea | $7,757,500 | $265,655,000 | 26 |
| East 58th Street | Midtown East | $7,295,000 | $238,370,000 | 19 |
Luxury sponsor units face rising competition from resale condos
Within the luxury tier, condo resale volume has been the most substantial. In June, 48 luxury resale condos went under contract, 10 more than a year ago, following 55 in May — the highest since December 2021.
As condo owners joined the market, resale condo inventory increased 5.6% year-over-year to 713 units, making it the largest segment within the luxury tier. The median asking price of these resale condos fell 1.4% to $6,895M. In June, the neighborhoods with the most resale condo inventory were all in Manhattan: Midtown (107 units), Tribeca (83), Lincoln Square (73), Lenox Hill (66), and the Flatiron District (49).

NYC homes under $1M on StreetEasy Article continues below
The increase in luxury resale condo units on the market is creating additional competition for sponsor units in luxury new developments. Though the newness of sponsor units may make them attractive to buyers, they also come at a premium. The median asking price per square foot of sponsor condos within the luxury tier was $2,979 in June, compared to $2,660 for non-sponsor resale luxury condos.
While luxury condo resales continued to rise this year, the number of luxury sponsor condo contracts moved sideways. In June, 14 of these units entered contract, seven fewer than a year ago, while inventory declined 18.8% year-over-year to 293 units. As sponsor condo contract volume remained stagnant, developers were likely more cautious about bringing additional supply to the market. In June, there were just 31 new luxury sponsor condo listings, down five from a year ago.
Meanwhile, those entering contract spent a median of 146 days on the market, up 31 days from a year ago. As higher-priced sponsor units linger on the market, the median asking price of luxury sponsor condos increased 4.7% year-over-year to $7.75M in June. This is slightly lower than $8.25M in May, which was the highest since April 2018.

The most valuable street for luxury co-ops was Fifth Avenue
While condos generally offer more flexibility of use and fewer restrictions on financing, luxury co-ops continue to offer a slightly lower price per square foot, at $2,060 in June.
NYC has more co-ops than condos, but luxury co-op units are harder to come by. In June, 311 luxury co-op units were on the market, up 3.8% from a year ago. Most of these units are on Fifth Avenue and Park Avenue on the Upper East Side, on Central Park West and West 72nd Street on the Upper West Side, and on Central Park South in Midtown. In June, 46.5% of luxury co-op inventory was on these five prestigious streets, with a combined value of $1.7T based on their asking prices.
In terms of contract volume, co-ops were the second most active luxury segment after resale condos. Citywide, 45 luxury co-op units entered contract, an increase of 18 from June of last year, likely reflecting resilient demand. Those entering contract spent a median of 103 days on the market, an increase of 28 days from a year ago.
Most valuable NYC streets for luxury co-ops on the market in June 2026
| Street | Neighborhood | Median asking price | Total value | Inventory |
|---|---|---|---|---|
| Fifth Avenue | Upper East Side | $8,972,500 | $716,100,000 | 58 |
| Park Avenue | Upper East Side | $7,000,000 | $549,773,000 | 63 |
| Central Park West | Upper West Side | $10,500,000 | $199,070,000 | 13 |
| Central Park South | Midtown | $6,650,000 | $105,530,000 | 12 |
| West 72nd Street | Upper West Side | $6,975,000 | $81,445,000 | 8 |
| West Broadway | Soho | $5,447,500 | $55,785,000 | 6 |
| Lafayette Street | Greenwich Village | $14,999,000 | $50,994,000 | 3 |
| Sutton Place South | Midtown East | $4,500,000 | $50,350,000 | 7 |
| East 67th Street | Upper East Side | $5,495,000 | $48,245,000 | 3 |
| East 64th Street | Upper East Side | $6,500,000 | $45,020,000 | 5 |
Demand for luxury townhouses has been soaring since 2023
Luxury townhouse inventory has been steadily rising since 2023. In June, there were 464 of these units on the market, making townhouses the second largest luxury segment. Traditionally, the Upper East Side and Upper West Side have been the largest markets, with 95 and 54 luxury townhouse listings in June, respectively. Park Slope ranked third with 34 units available, ahead of 23 in the West Village, 19 in Greenwich Village, and 19 in Midtown East.
Brooklyn continued to grow as a prime townhouse destination for affluent buyers. In June, the borough had 160 luxury townhouses on the market, an 18.5% increase from a year ago. Many of them can be found in neighborhoods traditionally known for brownstone townhouses. In addition to Park Slope, Cobble Hill, Brooklyn Heights, and Carroll Gardens had the most luxury townhouse inventory in June.
As inventory rose, luxury townhouse contract activity strengthened over the past three years. Throughout the city, 37 luxury townhouses entered contract in June. This matches the contract volume from June of last year and is the highest recorded by StreetEasy since 2010. The growing number of contracts signifies the increasing popularity of townhouses among wealthy buyers, a trend that has accelerated since the pandemic.

Townhouses are a unique niche in the city’s high-end market, as they offer complete ownership of a multi-story building in addition to premium private outdoor space. With a median asking price of $7.495M, luxury townhouses may appear pricier than condos or co-ops within the same tier, but buyers can get more living space for the same budget. The median asking price per square foot for luxury townhouses was $1,504 in June, the lowest among other luxury property types.
Luxury market data by property type in June 2026
| Resale condos | Sponsor condos | Co-ops | Townhouses | |
|---|---|---|---|---|
| Median asking price | $6,895,000 (-1.4% YoY) | $7,750,000 (+4.7%) | $5,988,000 (-0.2%) | $7,495,000 (-0.1%) |
| Median asking price per sqft | $2,660 (+0.4%) | $2,979 (+3.5%) | $2,060 (+4.7%) | $1,504 (-1.5%) |
| Inventory | 713 (+5.6%) | 293 (-18.8%) | 311 (+3.8%) | 464 (+0.7%) |
| New contracts | 48 (+10) | 14 (-7) | 45 (+18) | 37 (0) |
| Median days on market | 78 (+5) | 146 (+29) | 103 (+28) | 57 (-5) |
NYC rental market
As the summer rental market heated up, the citywide median asking rent increased 5.0% from a year ago to $4,200 in June, the highest on StreetEasy record since 2010. Inventory fell 1.4% to 35,761 rentals in June as demand continued to outpace supply.
Manhattan remained the city’s most competitive rental market. The borough’s inventory fell 4.4% year-over-year to 16,538 rentals in June, and the median asking rent increased 5.1% to $4,965. The shortage of multi-bedroom rentals intensified, with two-bedroom units down 9.3% and three-bedroom units down 11.0%. While studio inventory rose 1.2%, one-bedroom inventory declined modestly by 1.2%.
NYC rentals under $3,500 on StreetEasy Article continues below
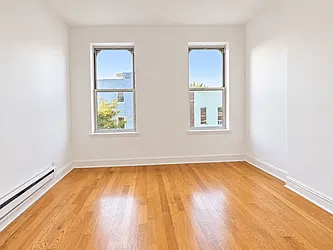
By contrast, inventory in Brooklyn rose 2.2%, the only borough with meaningful annual inventory growth in June. The borough’s median asking rent was $3,900, up 4.0% from a year ago. Brooklyn’s one-bedroom inventory increased the most, up 8.4% from a year ago. While studio and two-bedroom rentals increased 5.2% and 0.1%, respectively, rentals with at least three bedrooms fell 4.3%.
In Queens, inventory inched up by 0.6% in June, while the median asking rent increased 4.4% to $3,350. Inventory was at a similar level to a year ago, up marginally by 0.6%. With abundant new developments in the borough, 17.0% of rentals in Queens offered at least one month of free rent as concessions in June, higher than 13.7% in Brooklyn and 10.2% in Manhattan.
Supply shortages have been dominating the city’s rental market over the last few years. While new developments have expanded the rental supply recently, NYC still has a large gap to fill due to a decades-long undersupply of new housing. As a result, competition will likely remain fierce this summer, especially in Manhattan.
NYC market data: June 2026
Sales
 NYC |
 Manhattan |
 Brooklyn |
 Queens | |
|---|---|---|---|---|
| Median asking price | $999,999 (-9.1% YoY) | $1,386,500 (-6.9%) | $1,090,000 (-3.3%) | $689,000 (-0.9%) |
| Number of homes for sale | 18,124 (-0.4%) | 9,056 (-5.0%) | 4,630 (+3.1%) | 3,435 (+9.0%) |
| Homes entering contract | 2,349 (+18.6%) | 1,133 (+15.1%) | 680 (+26.4%) | 411 (+13.9%) |
| Median days on market | 58 (-2) | 64 (-4) | 52 (-1) | 55 (-4) |
Rentals
|
NYC |
Manhattan |
Brooklyn |
Queens | |
|---|---|---|---|---|
| Median asking rent | $4,200 (+5.0% YoY) | $4,965 (+5.1%) | $3,900 (+4.0%) | $3,350 (+4.4%) |
| Number of homes for rent | 35,761 (-1.4%) | 16,538 (-4.4%) | 13,491 (+2.2%) | 4,668 (+0.6%) |
| Share of rentals with price cuts | 13.2% (-0.2pp) | 14.0% (-0.2pp) | 13.1% (-0.9pp) | 12.1% (+0.1pp) |
| Share of rentals offering concessions* | 13.0% (+0.3pp) | 10.2% (+1.0pp) | 13.7% (-0.2pp) | 17.0% (0.0pp) |
Curious about the value of a buyer’s agent? Speak to our licensed StreetEasy Concierge for the details and get connected with a top agent.
StreetEasy is an assumed name of Zillow, Inc. which has a real estate brokerage license in all 50 states and D.C. See real estate licenses. StreetEasy does not intend to interfere with any agency agreement you may have with a real estate professional or solicit your business if you are already under contract to purchase or sell property. All data for uncited sources in this presentation has been sourced from Zillow data. Copyright © 2026 by Zillow, Inc. and/or its affiliates. All rights reserved.