
How to Sell Your NYC Home
Wise owners see their home as a home first, and an investment second, if at all. At the same time, everyone — especially New Yorkers — hopes for significant home price appreciation when they go to sell. So how much price increase can a seller expect on their NYC real estate? A new analysis of StreetEasy data reveals the median NYC home price appreciation: How much NYC property values increased over 5, 10, or more years of ownership.
The analysis looked at all StreetEasy submarkets in Manhattan, Brooklyn, and Queens, and includes homes purchased before 2019, and sold between 2017 and 2019. (StreetEasy divides each NYC borough into five groups of nearby neighborhoods — called submarkets — for the purpose of market analysis. See below for the makeup of each.)
Let’s first note that the shifts in property values detailed here took place in a market very different from today, with COVID-19.
Where was NYC home price appreciation highest? In the submarket of East Brooklyn, which includes the neighborhoods of Bushwick, Bed-Stuy, Crown Heights, and East New York.
East Brooklyn Sellers Doubled Their Money in a Decade
In these areas, owners who held their properties for 5-10 years made a median increase of 99% on their purchase price. That’s right: the average East Brooklyner who owned property for the better part of a decade, and sold between 2017 and 2019, may have doubled their investment, with price appreciation of about $414,000.
(Note: this analysis only looks at how much homes appreciated from one owner to the next. It does not address the total return on the owners’ investment, which depends on down payment size, financing, renovations and maintenance, and other factors.)
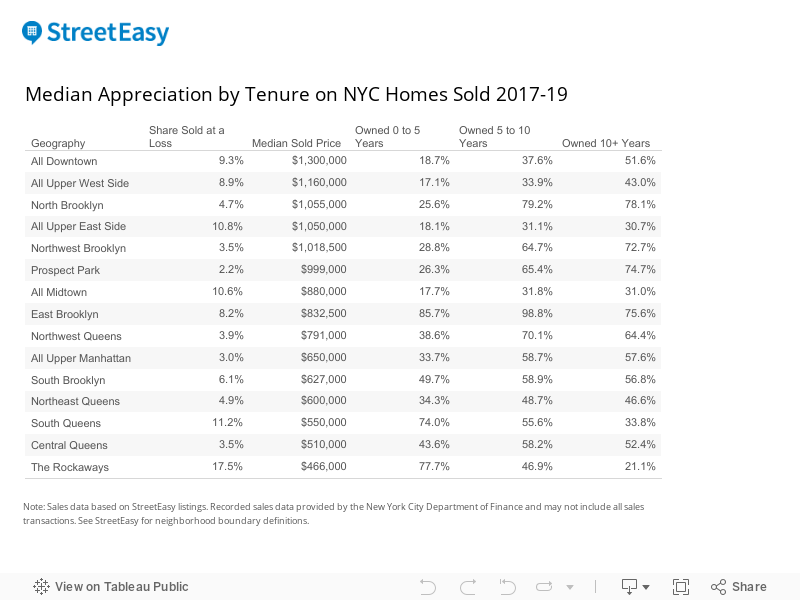
Meanwhile, home sellers on Manhattan’s Upper East Side saw the lowest appreciation, with those selling after 5-10 years gaining a median of 31%, or about $248,000, above their purchase price.
Upper East Side sellers who were only in their homes for zero to five years made just 18% at sale — a stark contrast with the 86% median growth seen over the same tenure in East Brooklyn.
Many NYC Home Sellers Lost Money
Our analysis also looked at the percentage of homes that sold for below their purchase price, regardless of how long they were owned.
The Upper East Side tied for second place here, along with Midtown Manhattan and South Queens (including Jamaica, Ozone Park, and Richmond Hill), where 11% of homes sold between 2017 and 2019 went for a loss.
Brooklyn 1-3BRs Under $800K on StreetEasy Article continues below
Sellers in the Rockaways Saw Greatest Losses
However, the Rockaways, Queens, claimed NYC’s greatest share of homes sold at a loss in this period, with 17% of owners losing money reselling their homes.
Unlike other submarkets in Queens, where prices rose consistently between 2012 and 2019, prices in the Rockaways were more volatile. They fell or remained flat between 2012 and 2016, and have only started to rise since 2017. Thus, the sellers who purchased in the Rockaways more recently made the greatest returns, while many owners across the submarket still sold at a loss due to price volatility.
Only 2% of Prospect Park Homes Didn’t Appreciate
On the flip side was the Prospect Park submarket of Brooklyn, which includes Park Slope, Prospect Heights, and Prospect Lefferts Gardens. Only 2% of home sellers there took a loss from 2017 to 2019.
In Upper Manhattan — Harlem, Washington Heights, and above — only 3% of sellers didn’t see any appreciation on their homes.
Which NYC Neighborhoods Appreciated Most in Under 5 Years?
So where did NYC property values rise the most in the least amount of time? It’s East Brooklyn again, where sellers after zero to five years saw median appreciation of 86%.
The Rockaways came second: buyers here saw median growth of 78% of their purchase price. In South Queens, it was 74%. (See below for the neighborhoods in every submarket.)
Important Caveats: The Market Has Changed
This analysis comes with a number of caveats: First, the COVID-19 pandemic has dramatically changed the dynamics of the city’s home sales market. Prices continue to fall in Manhattan, and have begun falling in Queens. Brooklyn was showing heightened buyer activity in August, especially at lower price levels and in the Prospect Park submarket.
The economic impact of the pandemic makes everything more uncertain. The market outlook appears fairly bright for Brooklyn, uncertain for Queens, and likely weak for Manhattan, which has record levels of inventory and many potential buyers looking elsewhere.
Therefore, home sellers across NYC today should not necessarily expect to earn what those selling from 2017 to 2019 did.
Manhattan 1-2BRs Under $800K on StreetEasy Article continues below


How the Economy Influences NYC Home Price Appreciation
Many of the data trends here are likely a result of citywide economic circumstances. The analysis includes homes owned for more than 10 years, which would mean many were purchased prior to 2009, during the market highs before the financial crisis.
Among this group of longer-tenured sellers, returns were not uniformly higher than those in the 5-10-year group. That’s likely because they bought just before a major market decline, while those in the 5-10 year group bought just after that decline, when the city’s economy was accelerating.
Don’t Try to Time the Market
“There are really three main factors that drive the potential return on your home,” says StreetEasy Economist Nancy Wu: “When you bought it, where you bought it, and how long you live in it.”
However, Wu cautions that homeowners should not try to time the market, no matter how tempting it may be. While economic trends are clear in retrospect, no one can guess where the market is going next — especially now.
“If you need to sell, sell,” Wu says. “Holding on to a home for longer than you want to in the hopes of greater appreciation just means sunk costs.”
Queens 2-3BRs Under $800K on StreetEasy Article continues below
How We Did It
Using data from ACRIS, New York City’s property records database, StreetEasy looked at all homes in Manhattan, Brooklyn, and Queens that were purchased since 2009 and sold between 2017 and 2019. We calculated the median percent sold above the initial purchase price for each tenure-submarket combination. Submarket-tenure groups with less than 100 units sold between 2017 and 2019 were excluded.
Which Neighborhoods Are in Each Submarket?
Manhattan Submarkets
All Downtown: Civic Center, Financial District, Tribeca, Stuyvesant Town/Peter Cooper Village, SoHo, Little Italy, Lower East Side, Chinatown, Two Bridges, Battery Park City, Gramercy Park, Fulton/Seaport, Chelsea, Greenwich Village, East Village, NoHo, West Village, Flatiron, NoMad, Nolita, West Chelsea, Hudson Square.
All Midtown: Roosevelt Island, Midtown, Central Park South, Midtown South, Midtown East, Midtown West, Murray Hill, Sutton Place, Turtle Bay, Kips Bay, Beekman, Hudson Yards, Hell’s Kitchen.
All Upper East Side: Upper East Side, Lenox Hill, Yorkville, Carnegie Hill, Upper Carnegie Hill.
All Upper West Side: Lincoln Square, Upper West Side, Manhattan Valley, Morningside Heights.
All Upper Manhattan: Manhattanville, South Harlem, West Harlem, Central Harlem, East Harlem, Hamilton Heights, Washington Heights, Hudson Heights, Fort George, Inwood, Marble Hill.
Brooklyn Submarkets
East Brooklyn: Bedford-Stuyvesant, Stuyvesant Heights, Bushwick, East New York, New Lots, City Line, Starrett City, Crown Heights, Weeksville, Ocean Hill, Brownsville.
North Brooklyn: Greenpoint, Williamsburg, East Williamsburg.
Northwest Brooklyn: Downtown Brooklyn, Fort Greene, Brooklyn Heights, Boerum Hill, Dumbo, Vinegar Hill, Red Hook, Gowanus, Carroll Gardens, Cobble Hill, Columbia St. Waterfront District, Clinton Hill.
Prospect Park: Park Slope, Windsor Terrace, Prospect Heights, Prospect Lefferts Gardens, Prospect Park South.
South Brooklyn: Farragut, Sunset Park, Wingate, Bay Ridge, Dyker Heights, Fort Hamilton, Bensonhurst, Mapleton, Bath Beach, Gravesend, Borough Park, Ocean Parkway, Kensington, Coney Island, Brighton Beach, Ditmas Park, Homecrest, Seagate, Flatbush, Midwood, Sheepshead Bay, Manhattan Beach, Fiske Terrace, East Flatbush, Canarsie, Flatlands, Marine Park, Mill Basin, Bergen Beach, Old Mill Basin, Madison, Greenwood, Gerritsen Beach.
Queens Submarkets
Central Queens: Woodside, Jackson Heights, East Elmhurst, North Corona, Elmhurst, Corona, Maspeth, Middle Village, Ridgewood, Glendale, Rego Park, Forest Hills.
Northeast Queens: Flushing, Whitestone, College Point, Fresh Meadows, Kew Gardens Hills, Kew Gardens, Bayside, Douglaston, Little Neck, Auburndale, Glen Oaks, Floral Park, Bellerose, Briarwood, New Hyde Park, Oakland Gardens, Hillcrest, Pomonok, Utopia, East Flushing, Murray Hill (Queens), Clearview, Malba, Beechhurst, Alley Park, Queensboro Hill, Bay Terrace (Queens).
Northwest Queens: Astoria, Long Island City, Sunnyside, Ditmars-Steinway, Hunters Point.
South Queens: Jamaica Hills, Woodhaven, Richmond Hill, Howard Beach, Ozone Park, South Ozone Park, Jamaica, South Jamaica, Hollis, St. Albans, Laurelton, Cambria Heights, Queens Village, Rosedale, Springfield Gardens, Jamaica Estates, South Richmond Hill, Hamilton Beach, Ramblersville, Rockwood Park, Old Howard Beach, Howard Park, Brookville.
The Rockaways: Far Rockaway, Broad Channel, Arverne, Rockaway Park, Bayswater, Belle Harbor, Breezy Point, Neponsit, Edgemere, Hammels, Rockaway All.
Disclaimer: The content on this site is not intended to provide legal, financial, or real estate advice. It is for informative purposes only, and any links provided are for the users’ convenience. Please seek the services of a legal, accounting, or real estate professional before any real estate transaction.
—
Whether you’re looking to rent or to buy, find your next NYC apartment on StreetEasy.