

July 2025 Housing Market Report
Key Takeaways:
NYC Sales Market
- Despite economic uncertainty, NYC saw solid July increases in new home contracts and listings without a surge in competition, indicating the sales market remains in balanced conditions.
- With more options to choose from, buyers are not feeling rushed; the median days on market is holding at 75 days.
- Manhattan’s median asking price is declining as sellers adjust prices strategically, but prices in Brooklyn and Queens are rising as condos capture a larger share of the market.
NYC Rental Market
- Rental inventory in NYC rose 4.9% in July, reaching 39,532 units, more than double the historic average monthly increase for this period.
- Despite the monthly increase, inventory is down 7.7% year-over-year, largely driven by an 11.2% decline in Manhattan — marking the 16th consecutive annual decline since March 2024.
- Several neighborhoods, particularly in Brooklyn and Queens, saw significant increases in rental inventory, with Gowanus experiencing a 144% rise from the previous year.

NYC Sales Market
Motivated buyers have been actively shopping for New York City homes despite the uncertain economic outlook. In July, 1,960 homes entered contract across the city, up 6.9% from last year. While volatile, mortgage rates have been marginally lower this year, drawing in more buyers from the sidelines.
Though demand has been hot, rising new listings have been keeping the temperature in check. The city saw 2,887 new sales listings in July, a 6.8% increase from a year ago. With more options to choose from, buyers aren’t rushing: homes that entered contract in July spent a median of 75 days on market, just one more day than a year ago.
With buyers and sellers more evenly matched, the median asking price has remained within the $1M–$1.1M range since September of last year. The citywide median in July was $1,050,000, up 5.0% from a year ago. Meanwhile, the median asking price has been declining in Manhattan, as more sellers enter the market with lower asking prices to accommodate patient buyers. In July, the borough’s median asking price fell 5.7% from last year to $1,410,000.
NYC Homes Under $1.1M on StreetEasy Article continues below


In Brooklyn, the median asking price rose 10.0% from a year ago to $1,099,000 in July, likely due to resilient buyer demand but limited inventory. The borough’s condo inventory jumped 13.5% to 1,448 units as condo resale activity accelerated across the city. Rising condo listings, along with new developments, have the potential to ease the competitive pressure and drive price growth in Brooklyn.
Queens, traditionally known for its sprawling co-op markets, saw a 29.4% jump in condo inventory. With rising new developments, the condo market share in Queens has increased to 43.3% from 34.5% since January 2023. As condos typically sell at a premium relative to co-ops, the borough’s median asking price has been trending up, rising 7.9% year-over-year to $689,358 in July.
On the whole, the NYC sales market remains in Goldilocks conditions, in which activity is elevated but anchored by stable supply. While the national market is experiencing slower buyer demand amid heightened economic uncertainty, according to Zillow data, both buyer demand and seller activity have remained stable in NYC. As long as mortgage rates continue their gradual downward trend this year, transactions could continue to rise while avoiding a flare-up in competition, as the NYC market saw in 2021-22. While it is difficult to predict where rates will go, buyers and sellers will likely see another busy fall shopping season.
NYC Rentals Under $3,500 on StreetEasy Article continues below
NYC Rental Market
Rental inventory continued to rise after a short-lived decline in the week of June 11 when the FARE Act took effect in NYC. In July 2025, citywide rental inventory rose 4.9% from June to 39,532 units. The monthly increase this July is more than twice the historic average of 1.9% in 2017–2019.
Compared to a year ago, current inventory is down 7.7%. The annual decline in inventory this summer follows solid gains in rental inventory last summer, when renters experienced relief from tough competition. Compared to 2022 when renters experienced scarce inventory and peak competition, inventory in July this year was up 19.1%.
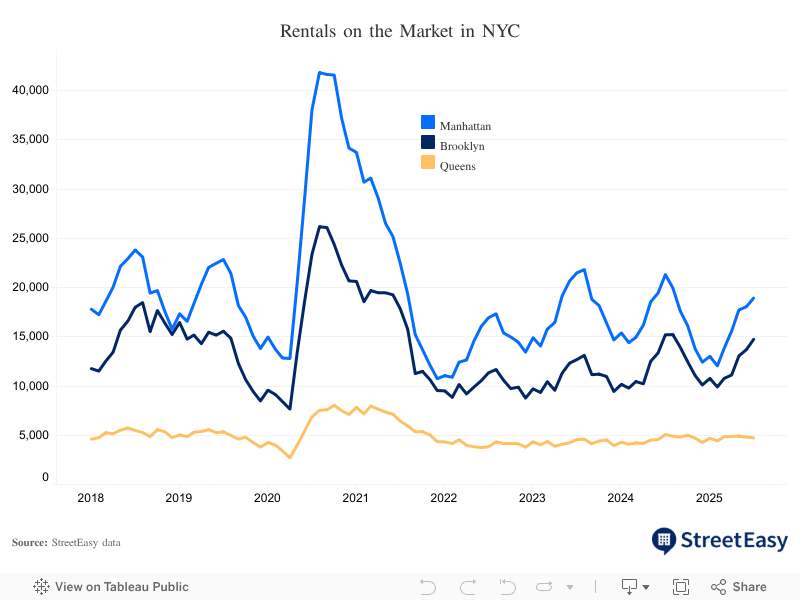
Manhattan saw the largest drop in inventory, with an 11.2% decline from a year ago — marking the 16th consecutive month of annual inventory declines in Manhattan. As declining inventory and strong renter demand drove competition in the borough, the median asking rent rose 8.5% year-over-year to $4,745 in July — the 11th consecutive month of annual rent increases in Manhattan. The ongoing tightening of the Manhattan market also helped drive the citywide median asking rent up 6.9% to $4,064 in July.
That said, the street tells a different story than the skyline in the NYC rental market. Rental inventory is rising in neighborhoods across Manhattan, Brooklyn, and Queens, where renters can now find more options compared to a year ago. Nine of the 10 neighborhoods with the fastest growing inventory in the city were in Brooklyn and Queens, as new developments continue to enter the market. Gowanus took the top spot with inventory more than doubling from a year ago, while Jamaica outpaced Long Island City as new construction rapidly expanded the neighborhood’s available rentals.
NYC Neighborhoods With Largest Increases in Rental Inventory, July 2025
| Neighborhood | Borough | Inventory (YoY Change) | Median Asking Rent (YoY Change) |
|---|---|---|---|
| Gowanus | Brooklyn | 392 (+144%) | $4,875 (+25%) |
| Inwood | Manhattan | 220 (+91%) | $3,153 (+43%) |
| Fort Greene | Brooklyn | 417 (+68%) | $4,500 (+12%) |
| Boerum Hill | Brooklyn | 249 (+58%) | $4,800 (+11%) |
| Jamaica | Queens | 244 (+44%) | $2,915 (-4%) |
| Downtown Brooklyn | Brooklyn | 679 (+28%) | $4,531 (+1%) |
| Midwood | Brooklyn | 263 (+22%) | $2,980 (+7%) |
| Prospect Heights | Brooklyn | 239 (+14%) | $4,460 (+2%) |
| Flatbush | Brooklyn | 984 (+9%) | $3,100 (+2%) |
| Long Island City | Queens | 1276 (+3%) | $4,500 (+5%) |
NYC Market Data: July 2025
Sales
 NYC |  Manhattan |  Brooklyn |  Queens | |
|---|---|---|---|---|
| Median asking price | $1,050,000 (+5.0% YoY) | $1,410,000 (-5.7% YoY) | $1,099,000 (+10.0% YoY) | $689,358 (+7.9% YoY) |
| Number of homes for sale | 16,761 (+11.6% YoY) | 8,612 (+9.1% YoY) | 4,122 (+11.6% YoY) | 3,022 (+18.6% YoY) |
| Homes entering contract | 1,960 (+6.9% YoY) | 931 (+11.5% YoY) | 529 (+2.1% YoY) | 389 (+5.7% YoY) |
| Median days on market | 75 (+1 YoY) | 90 (+6 YoY) | 63 (+2 YoY) | 63 (+1 YoY) |
Rentals
NYC | Manhattan | Brooklyn | Queens | |
|---|---|---|---|---|
| Median asking rent | $4,064 (+6.9% YoY) | $4,745 (+8.5% YoY) | $3,800 (+6.1% YoY) | $3,375 (+7.1% YoY) |
| Number of homes for rent | 39,532 (-7.7% YoY) | 18,936 (-11.2% YoY) | 14,742 (-3.0% YoY) | 4,736 (-6.6% YoY) |
| Share of rentals with price cuts | 15.6% (-0.8pp YoY) | 18.2% (-0.3pp YoY) | 14.0% (-1.7pp YoY) | 12.1% (+0.2pp YoY) |
| Share of rentals offering concessions* | 14.3% (+2.5pp YoY) | 10.1% (-0.8pp YoY) | 16.6% (+6.0pp YoY) | 19.4% (+5.0pp YoY) |
Curious about the value of a buyer’s agent? Speak to our licensed StreetEasy Concierge for the details and get connected with a top agent.
StreetEasy is an assumed name of Zillow, Inc. which has a real estate brokerage license in all 50 states and D.C. See real estate licenses. StreetEasy does not intend to interfere with any agency agreement you may have with a real estate professional or solicit your business if you are already under contract to purchase or sell property. All data for uncited sources in this presentation has been sourced from Zillow data. Copyright © 2025 by Zillow, Inc. and/or its affiliates. All rights reserved.