

Key takeaways:
- Rent growth remains stable even among listings newly forgoing broker fees after the FARE Act, rising less than 1% above the average rent growth for the remainder of the market
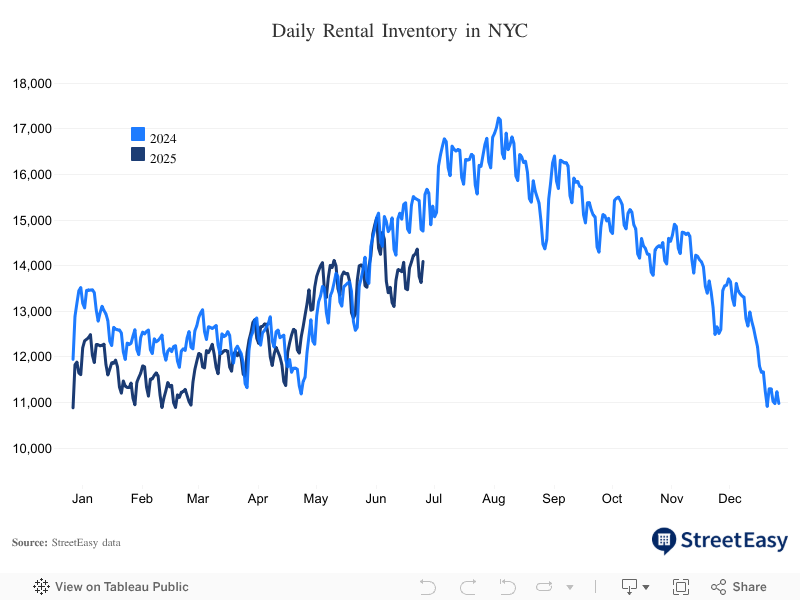
- Following a temporary dip likely caused by brokers hitting pause, daily rental inventory increased 4.2% by the end of June
- Rising inventory in the outer boroughs will expedite the transition to the new normal, as inventory rose 10.7% in Queens and 1.9% in Brooklyn from a year ago despite the FARE Act
- Seasonal trends and market forces — independent of the FARE Act — have been the primary drivers of rent growth, with summertime peak demand and a tighter Manhattan market driving up rent growth
Early data following the implementation of the Fairness in Apartment Rental Expenses (FARE) Act on June 11 indicates the New York City rental market remains stable. While there was a drop in rental inventory following June 11, the decline was temporary and limited to broker-represented rentals that were likely adjusting to the need for new compensation agreements. Since then, the outflow of listings from NYC’s inventory has stabilized while the inflow has been robust. Seasonal trends and a shifting balance between supply and demand — independent of the new law — have remained the driving forces behind rental prices. Here are four takeaways from the recent data through the end of June.
Manhattan Rentals Under $3,500 on StreetEasy Article continues below


1. Rent growth remains stable, even among listings newly forgoing broker fees
Contrary to concerns that landlords would sharply increase rents to offset the cost of broker fees, rent growth has remained mostly stable since June 11. Listings that charged a broker fee prior to the FARE Act’s implementation saw an average annualized1 rent increase of 5.3% from the last time they were on the market with a broker fee. This is less than one percentage point above the 4.5% average rent growth for units that had already been no-fee before the new law.
This narrow spread is likely due to constraints imposed by market conditions. Though the city’s rental vacancy rate remains low, property managers have not yet tried to fully pass on the additional costs of directly compensating rental brokers, or operating in-house leasing teams, in the form of higher monthly rents. Ultimately, market conditions — not just property manager expenses — drive rents.
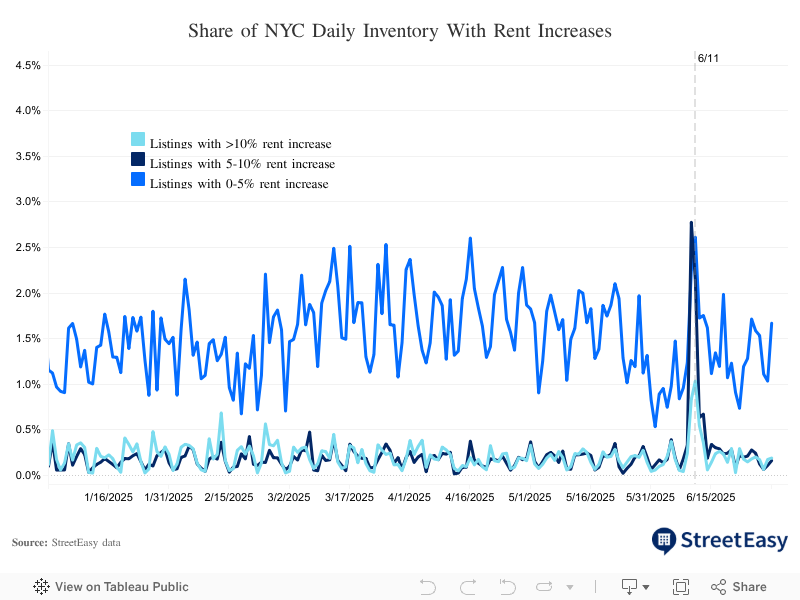
Renters have options, especially in neighborhoods where inventory has been solidly rising, and early data suggests few property managers are willing to risk pricing themselves out of renter demand. Since the FARE Act’s implementation, just 1.7% of all rentals have raised asking rents by more than 10%, and only 1.8% raised rents by 5-10%. Among properties that raised rents after the new law, the median rent increase has been 4.2%, a small jump from 3.3% during the same period last year.
These small percentages indicate most property managers are not responding to the FARE Act by rushing to increase asking rents. Instead, they are likely adjusting prices carefully and strategically, for the time being, to stay compliant and competitive.
Brooklyn Rentals Under $3,000 on StreetEasy Article continues below


2. Following a short-lived decline caused by brokers hitting pause, rental inventory is recovering
Within the first three business days following the FARE Act’s enactment, rental inventory in NYC fell by 1,049 units — equivalent to 3.1% of the average citywide inventory in June over the past three years. Listings represented by brokers made up 93.9% of the decline in inventory. Meanwhile, the inventory of rentals directly represented by property managers remained steady.
The sudden drop in broker-represented listings was likely driven by rental agents and property managers who did not work out a revised compensation agreement that complies with the new law before its implementation. The outflow of listings has since stabilized and followed usual seasonal trends associated with summertime leasing activity. On average, the outflow of rental listings has averaged 720 per day since the initial decline in inventory following the FARE Act, compared to 735 per day during the same period last year.
Summer is when renter demand — and as a result, prices — peak in NYC. Property managers are incentivized to return to the market as soon as possible to capitalize on strong renter demand, and the FARE Act does not change this typical seasonal trend. As such, we expect many of these rentals to return to the marketplace gradually this summer.
Early data indicates rental inventory recovery is already underway, driven by a robust flow of new listings into the market. Since June 11, 730 new listings have been joining the market each day, versus 735 during the same period last year. As a result, daily inventory increased by 4.2% to 14,094 by the end of June. While the current level is 4.5% lower than the same time last year, it is still 40.0% higher than in 2022 when renter competition peaked. The flow of new listings, at a pace well within the range of prior market trends, gives us confidence that the FARE Act’s impact on inventory levels will be short-lived.
Queens Rentals Under $2,500 on StreetEasy Article continues below


3. Rising inventory in Brooklyn, Queens, and the Bronx will expedite the transition to the new normal
The recent surge in new developments in the outer boroughs has been filling the gap in the city’s inventory since the pandemic, in addition to providing thousands of rent-stabilized affordable units for low- to medium-income New Yorkers. By contrast, inventory in Manhattan has been declining since last year, dragging down citywide inventory growth well before the FARE Act. Heated competition among renters resulted in accelerating rent growth in the borough.
Various incremental rezonings across Brooklyn, Queens, and the Bronx since the 2000s have allowed for new developments across the three boroughs. As a result, these boroughs have been capturing an increasingly large share of the city’s rental market, while Manhattan’s share has been declining. Many of these new units were already (and have always been) no-fee, as leasing and marketing for new developments tends to be carried out by the property manager directly, or a dedicated team hired by the property manager under a clear compensation agreement.

As a result, inventory is still higher in Brooklyn and Queens than a year ago, despite the initial drop in broker-represented listings. As of June 30, rental inventory was up 1.9% from the previous year in Brooklyn and up 10.7% in Queens. The steady flow of new listings from new developments will likely help the city’s rental market transition to the new normal efficiently.
4. Seasonal trends and market forces remain the primary drivers of rent growth
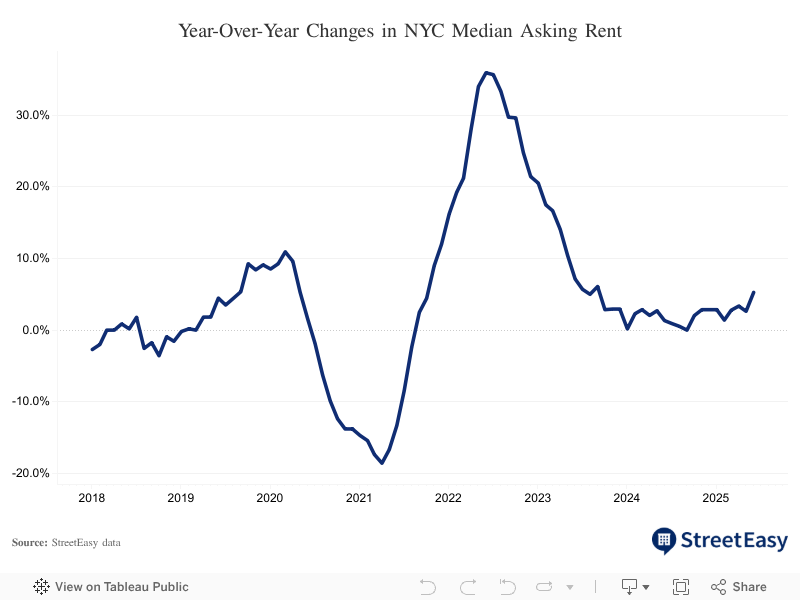
The citywide median asking rent for June came in at $4,000, 5.3% higher than a year ago. The annual rent growth in June was nearly double the average between January and May of this year — a pick-up that is likely temporary as it reflects a rental market in transition. While the share of no-fee rentals had been on the rise since the pandemic, 44% of NYC rentals still came with a broker fee prior to the FARE Act. Given this considerable share, a period of adjustment is as expected. Beyond this summer, seasonal trends and market forces — independent of the FARE Act — will continue to be the primary drivers of the rental market’s trajectory.
The noteworthy trend driving rent growth right now is increasing competition among renters in Manhattan. The Manhattan market has been tightening since last September, as macroeconomic forces such as high mortgage rates and other affordability challenges continue to keep potential home buyers in the rental market. As a result, rental inventory in Manhattan has been steadily declining, increasing competition among Manhattan renters and fueling the borough’s — and the city’s — rent growth. Though rent growth has been significantly more modest in the outer boroughs thanks to rising inventory, Manhattan has accelerated the citywide pace.
That said, the NYC rental market has undergone larger shifts in the past. When the rental market was red-hot in 2022, the citywide median asking rent soared 35.9% year-over-year in June. As competition gradually cooled, annual rent growth slowed to a still substantial 7.1% in June 2023. During a cooler-than-usual summer rental market last year, the median asking rent rose just 1.3% in June.

Conclusion
That said, NYC is one of the largest rental markets in the nation, with more than 2.3 million rental properties across the five boroughs split between rent-regulated and market-rate units, according to the 2023 NYC Housing and Vacancy Survey. It will take time to gather additional data to gauge the long-term impact on rents and inventory across the entire city, in addition to how well brokers and property managers are complying with the new law.
While the NYC rental market is in the early stages of transition following the FARE Act, incoming data since June 11 suggests the market is already on a path to recovery after a temporary decline in inventory. Early data indicates rent growth among rentals dropping broker fees since the FARE Act has been stable. Compared to historical changes in inventory and rent growth, early data on rental prices indicates seasonal dynamics and market forces are still in the driver’s seat, rather than regulatory changes brought forth by the FARE Act.
- As the time it takes for a property to reappear on the market can vary, we annualized the price changes between repeat listing pairs. Annualization projects data measured over varying timeframes as if it lasted for one full year, enabling consistent comparison of price changes regardless of differing time periods. ↩︎
StreetEasy is an assumed name of Zillow, Inc. which has a real estate brokerage license in all 50 states and D.C. See real estate licenses. StreetEasy does not intend to interfere with any agency agreement you may have with a real estate professional or solicit your business if you are already under contract to purchase or sell property. The information contained herein is for informational purposes only and should not be relied upon when making a real estate decision. All data for uncited sources in this presentation has been sourced from Zillow data. Copyright © 2025 by Zillow, Inc. and/or its affiliates. All rights reserved.