The number of home sales is falling around NYC because fewer buyers can afford what’s on the market.
Sales of condos and co-ops in Manhattan hit their lowest quarterly levels since 2009 earlier this year, with the largest year-over-year drop since the financial crisis. The fall in recorded sales numbers extends beyond condos and co-ops to single family homes and townhouses, and is not limited to Manhattan. Nor does it appear to stem from concerns over interest rates, higher taxes, or other macro factors.
While the recent federal tax reforms and rising interest rates have complicated the math for would-be buyers, the low numbers of condos and co-ops sold in early 2018 have much more to do with a steady decline in inventory at price points most New Yorkers can afford, echoing the national shortage of affordable homes for sale. As the price of entry into many traditionally affordable neighborhoods has risen, the city is simply offering fewer and fewer homes accessible to the vast majority of buyers.
Sales Have Fallen Steadily for 5 Years
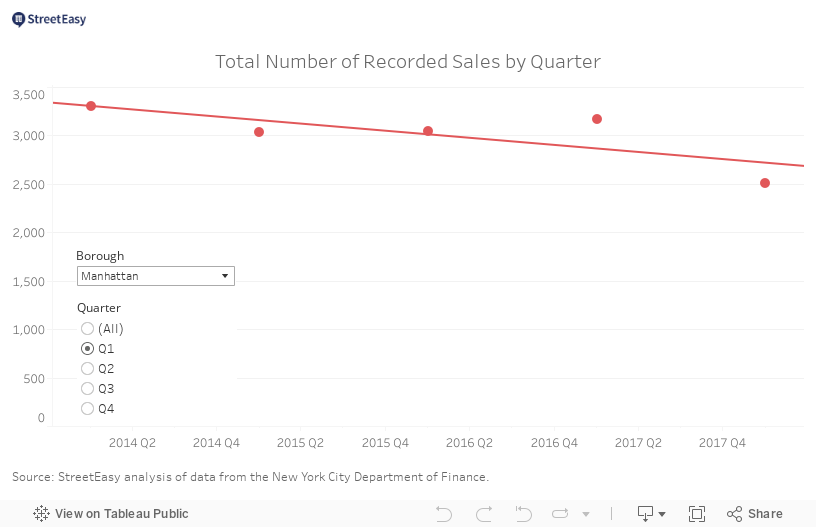
Looking back on the past five years, we see that the latest numbers broadly align with a trend that began in 2013. The 15 percent drop in recorded sales between the fourth quarter of 2017 and the first quarter of 2018 was one of 16 such drops since the start of 2010. More than half of those quarter-on-quarter declines were larger than the most recent one.
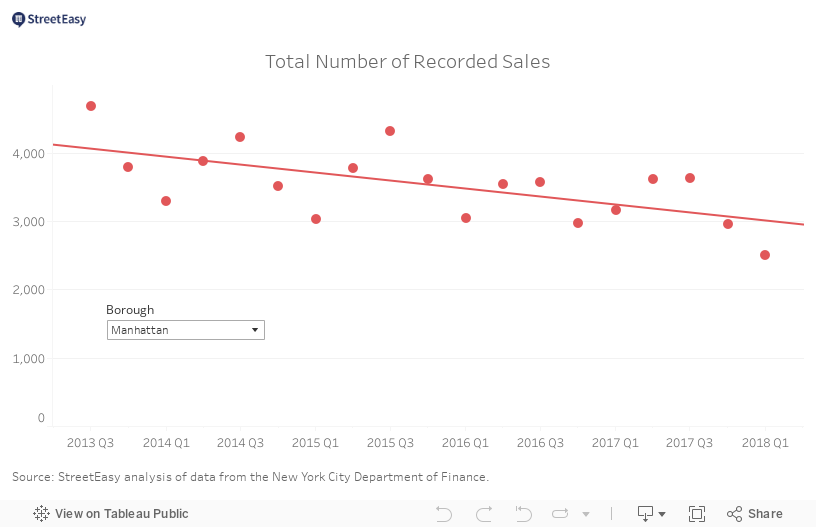
The differences between each of these points and the broader downward trend are largely explained by the highly seasonal nature of the market for homes, with the first quarter of each year consistently registering the lowest numbers of the year. As the figure below shows, the most recent reading falls largely in line with the longer-term trend. The largest deviation from this trend was an abnormally high spike in the first quarter of 2017, a point crucial to explaining the large year-on-year drop in sales volume in 2018.
The five-year pattern of falling sales indicates that there’s a much deeper force holding back purchases than passing concerns over interest rates or new tax code changes. Rates for 30-year fixed mortgages currently sit at their highest level since early 2014. However, rates fell for most of the period between early 2014 and late 2016, and should have helped would-be buyers afford homes, thereby boosting, not weighing on, recorded sales. Similarly, while the tax reforms enacted in late 2017 may cause concern among higher-income buyers who were counting on deducting their property taxes, the trend of falling recorded sales volume significantly predates any speculation over the bill or its contents.
Conventional Wisdom Fails to Explain the Downward Trend
More broadly, attributing the lower sales numbers to weaker demand for homes in the city contradicts the broad increase in home prices across the city over the past several years. StreetEasy Price Indices for Manhattan, Brooklyn, and Queens all rose at roughly 4 percent per year between the peak in recorded sales in the third quarter of 2013 and the first quarter of 2018.
A dearth of total supply also fails to explain the fall in recorded sales volume. The number of cranes on the city skyline shows the abundance of new supply, and the inventories of homes listed for sale on StreetEasy increased in all boroughs during this period. High-priced luxury units are lingering on the market longer than ever — we estimate that for each $100 price per square foot increases, a unit will spend an additional week on the market — and these pricey homes largely explain the buoyant inventory figures.
But while luxury homes continue to linger on the market, the inventory of homes affordable to typical New York City homebuyers tells a very different story.
Fewer Sales Are Emblematic of the City’s Affordability Crisis
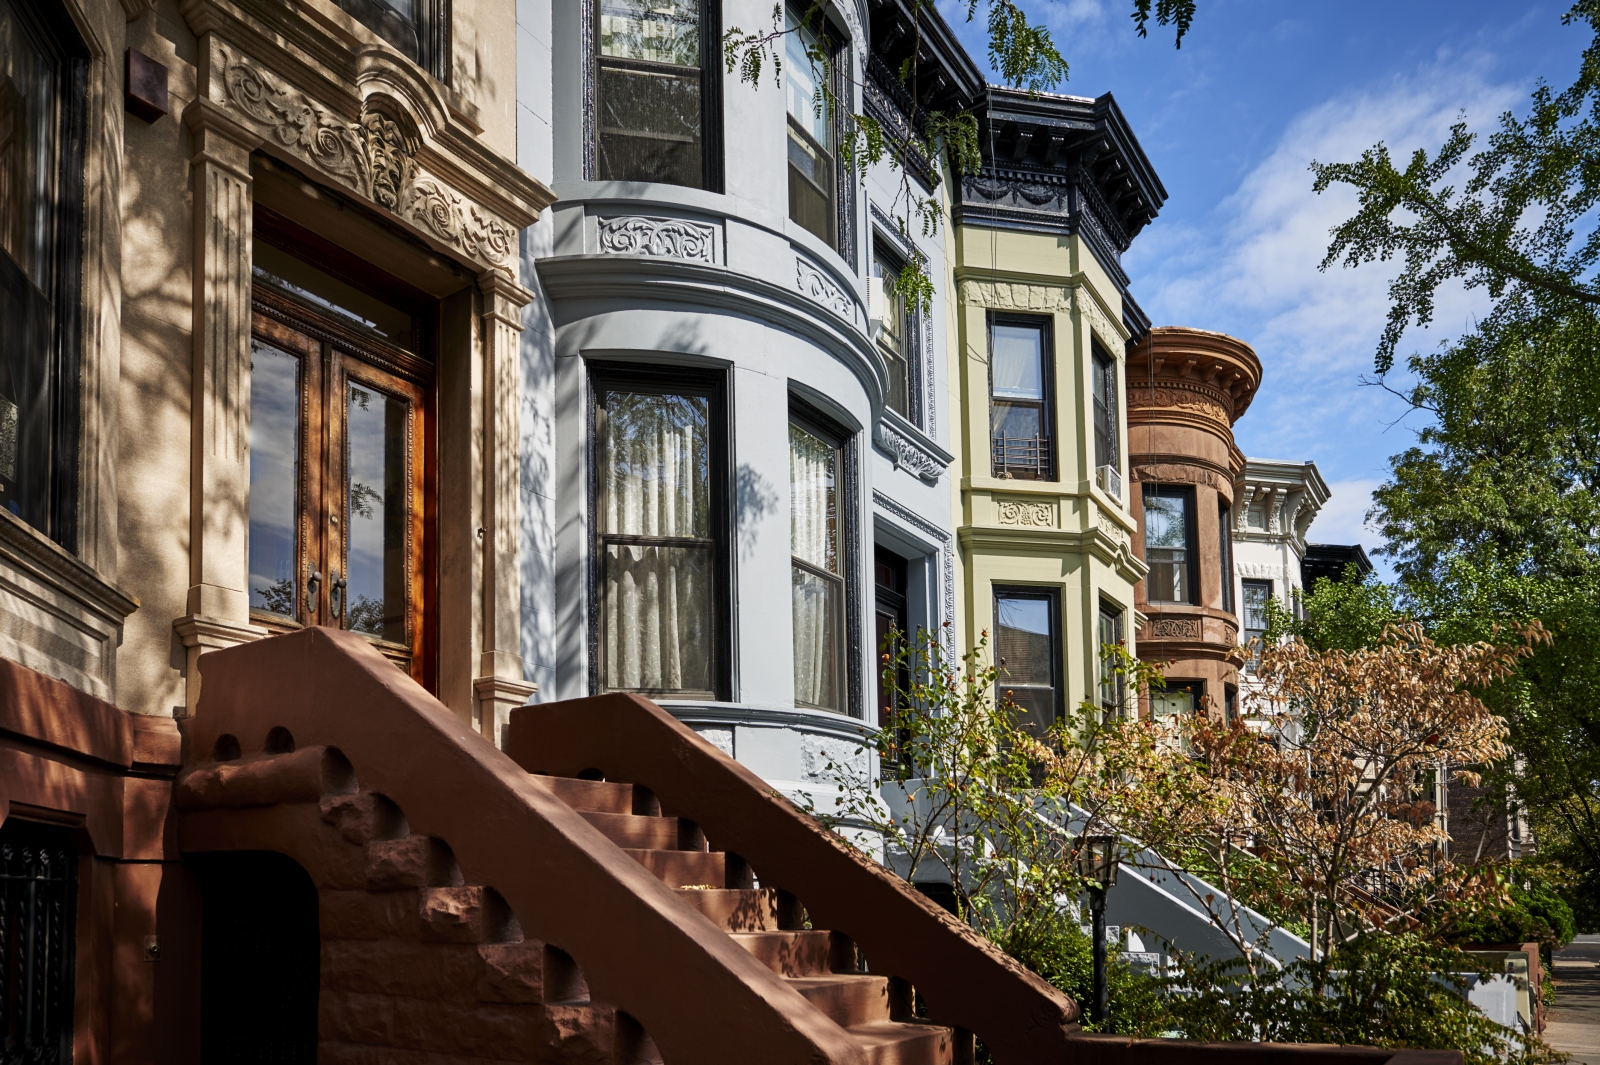
The likely culprit for the fall in sales volume is the gradual disappearance of affordable homes throughout the five boroughs, including in many areas that traditionally drew professionals seeking a larger home in which to raise a family. As we highlighted in a recent market report, Brooklyn neighborhoods Carroll Gardens and Park Slope now rank among the city’s most expensive by median recorded sale price. While high-priced townhomes have been fixtures of these areas for over a decade, they had long coexisted with more affordable options that are increasingly difficult to find.
As a result, those shopping for homes that can accommodate a growing family have lately found a rapidly shrinking inventory in many popular neighborhoods. The share of 2-bedroom apartments listed for less than $1 million on StreetEasy fell by more than half between 2010 and 2017 in 32 neighborhoods across the city, a far greater share than can be explained by the average increase in New York City housing prices over the period. StreetEasy had 1,100 more 2-bedroom listings in 2017 than in 2010, but 700 fewer priced at $1 million or less.
A handful of neighborhoods are emblematic of this shift. In the Upper West Side, 36 percent of the 2-bedroom homes listed on StreetEasy in 2010 were below $1 million. In 2014, fewer 2-bedrooms were listed, and the share below $1 million dropped to 17 percent. In 2017, there were fewer listings still and the share fell to just 9 percent. In Brooklyn’s Carroll Gardens, 89 percent of 2-bedrooms were priced below $1 million in 2010; in 2017, the share fell to just 30 percent. In Queens, 80 percent of the 2-bedrooms listed in Long Island City in 2010 were priced below $1 million; in 2017, it was a mere 12 percent.
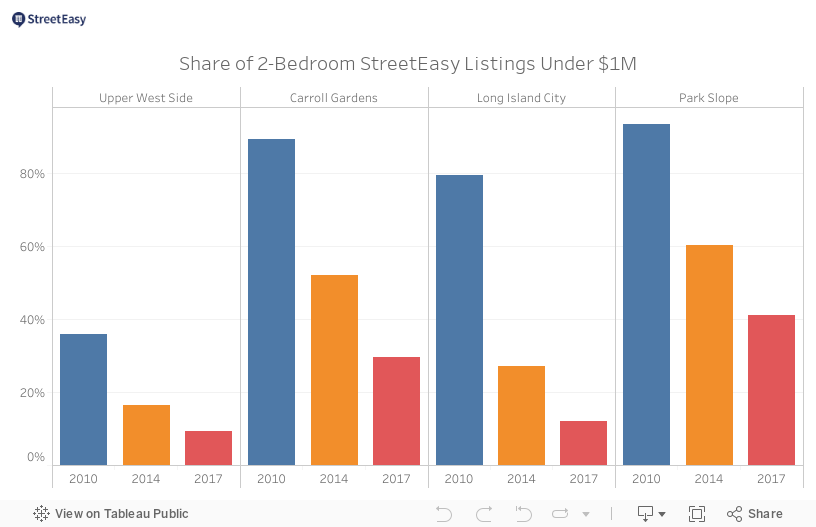
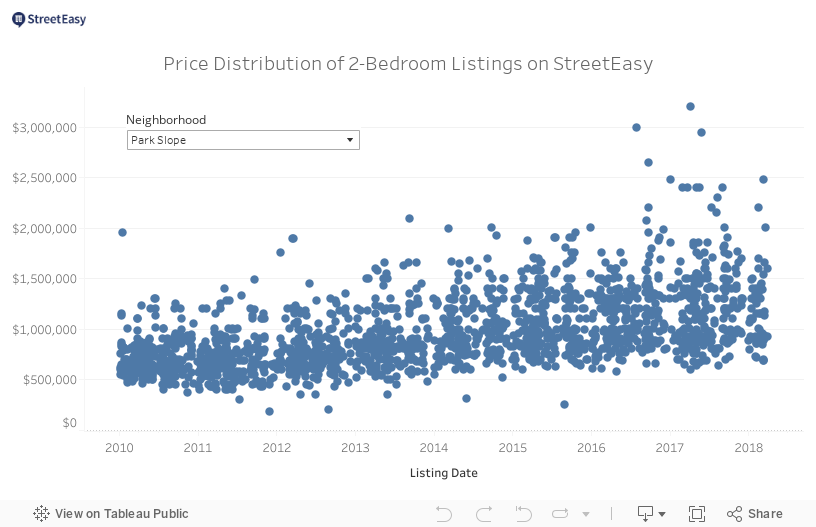
Park Slope — traditionally associated with its legions of strollers and progressive food cooperative — shows the same trend, with homes priced at $1 million or less dropping from 93 percent of all 2-bedroom listings on StreetEasy in 2010 to just 41 percent in 2017. The lower the price, the more stark the contrast: 66 Park Slope homes with 2 bedrooms were priced below $500,000 from 2010 through 2013. Since the start of 2014, only two units of this size in the neighborhood have been listed for less than $500,000 — one with a rent-controlled tenant and the other in an income-restricted HDFC. The last 2-bedroom apartment to list for less than $500,000 without considerable restrictions was this sponsor unit in a co-op on Sixth Street, which was first listed in late 2013 for $475,000. Earlier this year, it returned to the market, and went into contract in April for $685,000, a price gain of 9 percent per year.
This pace of appreciation reflects the boom in demand for affordable homes, and it far exceeds the speed at which wages and other costs have risen in the city. While price growth is a normal part of any healthy real estate market, the average pace of home price growth in New York City — just 2.7 percent per year according to the StreetEasy Price Indices — fails to explain the disappearance of affordable homes. Homes at the lower end of the price spectrum are simply appreciating at a faster rate than those at higher price levels.
Hope for Aspiring Buyers
However, as we highlighted in our predictions for 2018, prices at the top of the market are falling. Sellers are increasingly relying on price cuts to move higher-end inventory that’s been sitting on the market. With significant new development happening throughout the five boroughs, market forces will undoubtedly discount unsold inventory to find demand at more affordable price levels. But the extent to which this trickles down to price points accessible to the biggest groups of New York home buyers remains to be seen.
—
Hey, why not like StreetEasy on Facebook and follow @streeteasy on Instagram?