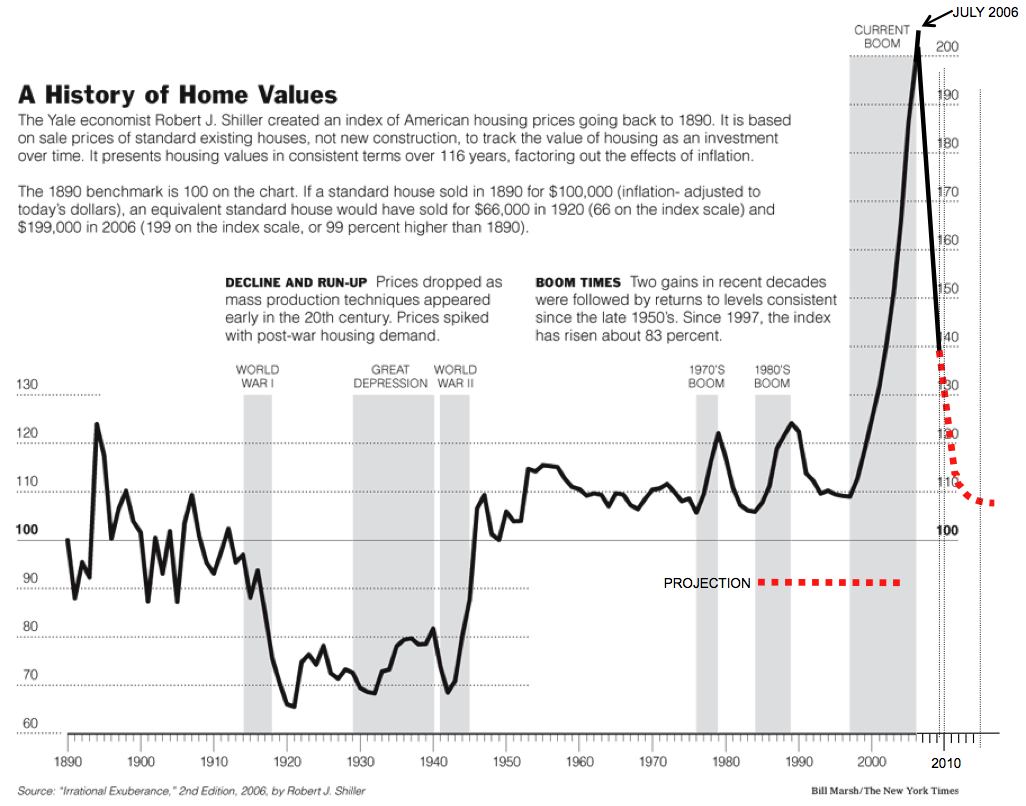
The Shiller Chart Updated...

Started by nyc10022
about 17 years ago
Posts: 9868
Member since: Aug 2008
Discussion about
Add Your Comment
Recommended for You
-

From our blog
NYC Open Houses for November 19 and 20 - More from our blog
Most popular
-
28 Comments
-
8 Comments
-
33 Comments
-
7 Comments
-
12 Comments
Recommended for You
-
From our blog
NYC Open Houses for November 19 and 20 - More from our blog
Thanks, nyc.
Any idea who Steve Barry is? Presumably the projection is his.
Good to get some historical perspective. If I read that correctly, real estate hit a high around 1895 and then did not reach that inflation-adjusted high again until 1988. 90+ years.
thats a fairl conservative projection..... the big jumps generally overshoot to the downside...
While Shiller does not expect a rapid rebound, he does say:
“My guess would be that home prices are going to level off — they’re not going to keep falling,”
While this is more on a national level, due to the 20 area composite, that is some potential good news.
Yah, only two more years of declines in NYC!
Well, I was speaking on a larger scale, that this could potentially signify the bottom is near for home prices for a large chunk of the country. That would be good for the overall economy.
yes, this is good news. Unfortunately nobody will know for sure when housing has bototomed until long after the bottom has passed since housing data is lagging.