
Home shopping season is just around the corner, and StreetEasy has predicted it will be a busy year for buyers and sellers. Since the pandemic and the rise of remote work, space has become a prime component of the decision-making process when buying a home. To help New Yorkers find the most room for their money, StreetEasy’s January 2022 Market Reports reveal where in NYC the asking price per square foot (PPSF) is falling and where it is rising.
Buyers Get the Best Price Per Square Foot in Queens
StreetEasy analyzed the median asking price per square foot in Manhattan, Brooklyn, and Queens for this report. Of the boroughs analyzed, Queens had the lowest median asking price per square foot of $540. In other words, for $950,000, which was the median asking price for a New York City home in January, a homebuyer in Queens could get a median of 1,759 square feet of space.
How does that compare to other boroughs? In Brooklyn, the median asking price per square foot in January was $666, equivalent to 1,427 square feet of space on a $950,000 budget. In Manhattan, the median PPSF is over $1,000 more than in Queens — a whopping $1,612 for one square foot of space. That means a buyer with a $950,000 budget could afford 589 square feet of space in Manhattan as of January.
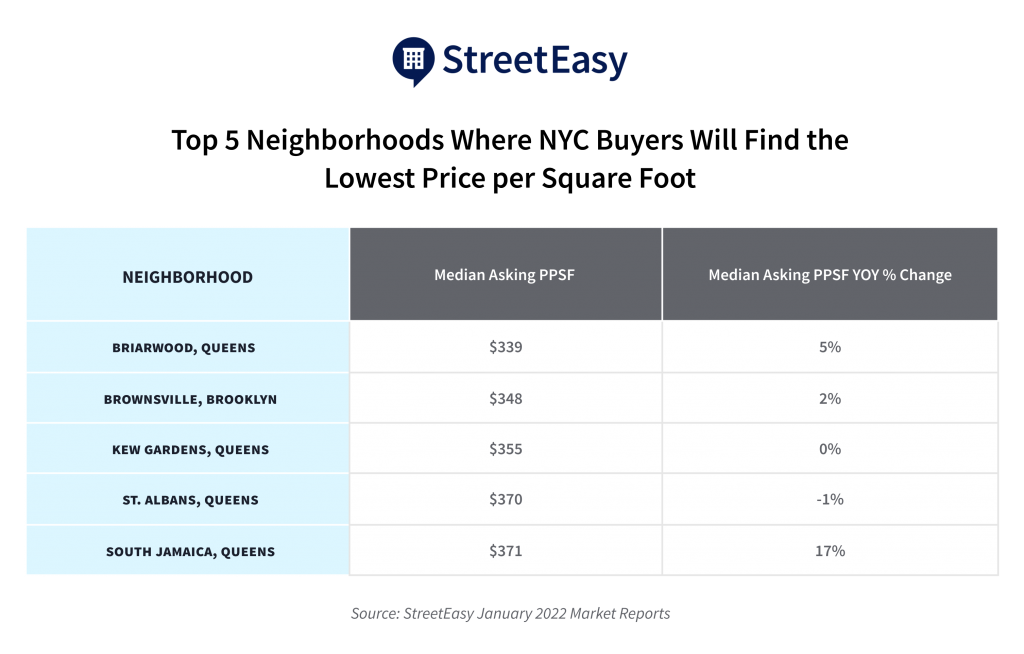
Savvy home buyers looking for specific neighborhoods that offer the most square footage for their money should check out the chart below. The top four areas are in Queens, with one neighborhood in Brooklyn taking second place.
In Brooklyn, the Price per Square Foot Is Dropping
In January, the median asking PPSF in Brooklyn was $666 — down 3.8% since last year. This is a promising shift for those looking to Brooklyn for more space for their money.
Overall in the borough, the median asking price for a home stayed flat since last year at $899,900, but signaling the drop in PPSF were the types of homes coming onto the market. According to StreetEasy economist Nancy Wu, larger homes coming onto the market for lower prices contributed to the PPSF dropping while the overall median stayed the same.
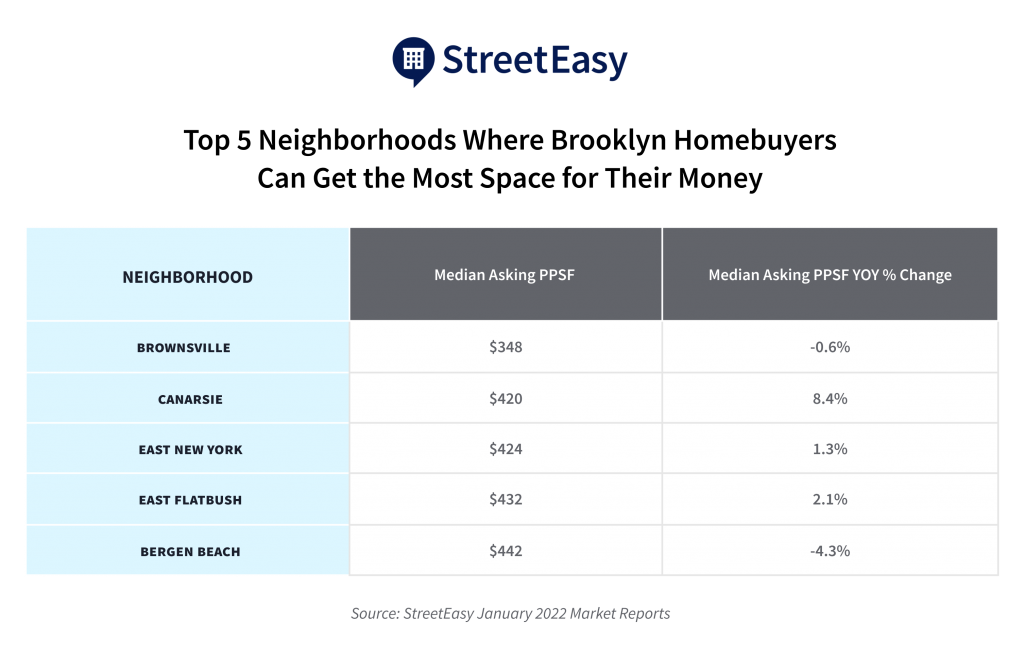
But the drop in PPSF doesn’t mean interest in the borough is waning. Brooklyn is red hot. There were 658 contracts signed for homes in Brooklyn in January — 5.6% more than last year. And the numbers add up. Many buyers opting for Brooklyn homes can’t afford the steep cost of more space in Manhattan. To help inform your Brooklyn home buying decision, below you will find neighborhoods in the borough where you can get the most and the least amount of space for your money, according to StreetEasy January 2022 data.

Manhattan’s Price Per Square Foot Increased the Most Since 2015
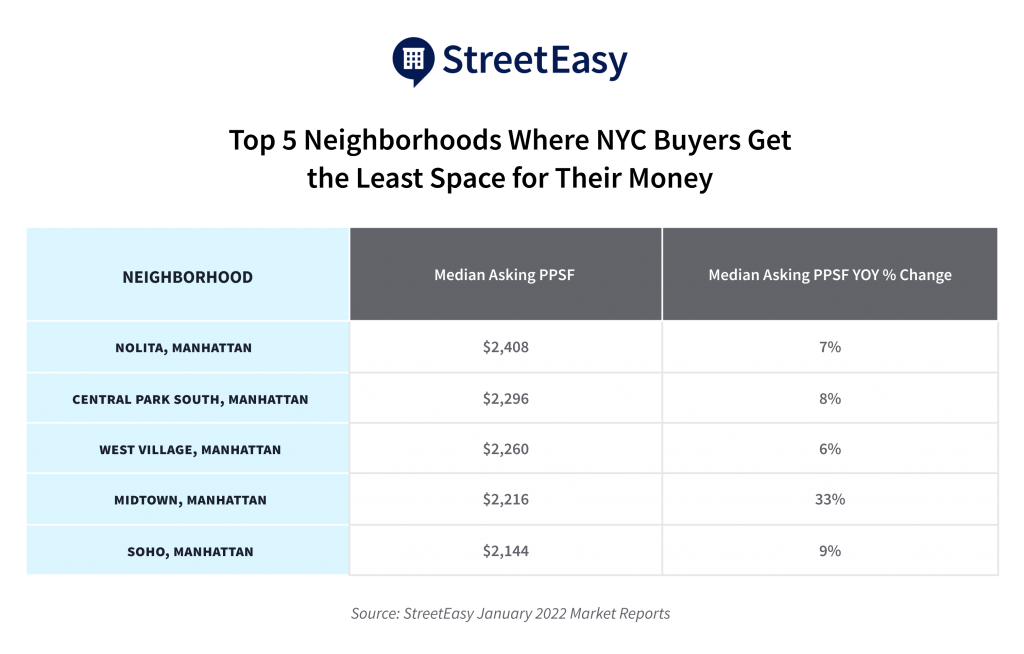
The five neighborhoods with the highest PPSF in New York City are all in Manhattan, and these areas are getting more expensive. As of January, the median asking PPSF rose 11.1% year-over-year to $1,612 in the borough because of these steep increases. This annual increase was the largest StreetEasy has seen since 2015.
The luxury housing market boosted the PPSF in Manhattan. The cost for the top quintile rose 15.5% to $2,274 in January. At the same time, the PPSF for the most affordable Manhattan homes fell 6.8% to $714. The upshot? Buyers will find Manhattan homes in a broad range of prices and sizes.
“There is a real separation between what is happening in Manhattan and the rest of New York City right now. The price for a single square foot of space in Manhattan is more than double Brooklyn and Queens. For anyone prioritizing more space for less, looking outside of Manhattan is almost a no-brainer. But if they have the means, Manhattan is still a great option to find space.” says StreetEasy Economist Nancy Wu.
“Manhattan sellers have been pricing according to the strong demand for luxury homes over the past several months, but that may start to cool off soon with new inventory set to hit the market this spring. As inventory rises, sellers may need to lower prices to attract buyers who are also considering much larger homes just across the bridge.”
For buyers on any budget, StreetEasy’s tools and data can help you make an informed decision. The StreetEasy Data Dashboard offers the latest reports and interactive tools to help buyers, sellers, and renters throughout their home journeys.
Find out more about the sales market in Manhattan, Brooklyn, and Queens below.
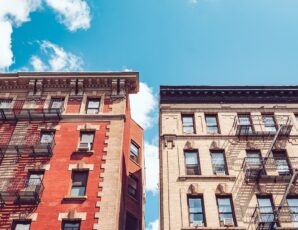
Manhattan Asking Prices Continue To Rise
The median asking price for a Manhattan home was $1.5M in January, up 13.2% from last year and the highest since May 2020. At the same time, the number of contracts signed in Manhattan fell for the second month in a row. There were 1,031 contracts signed in Manhattan in January — down from the peak of 1,642 contracts signed in the borough in April 2021.
The number of Manhattan homes for sale dropped to its lowest level since June 2020, when New York City real estate activity was still essentially frozen due to the pandemic. In January, there were 7,733 homes on the market, down 34% from the pandemic high of 11,690 in October 2020.
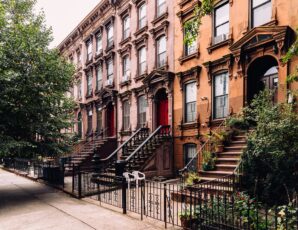
Brooklyn Prices Stay Flat
The median asking price in Brooklyn remained unchanged compared to last year at $899,900. Similar to Manhattan, January was the second month there has been a drop in the number of contracts signed in Brooklyn with 658 contracts signed in January, but that was still 5.6% more than last January. In May 2021, Brooklyn saw a record high 1,030 contracts signed.
Brooklyn inventory fell 16.1% compared to last year, with 4,341 available homes for sale on the market. This was the lowest it’s been since May 2020, and down significantly from the record high 6,094 homes on the Brooklyn market in October 2020.
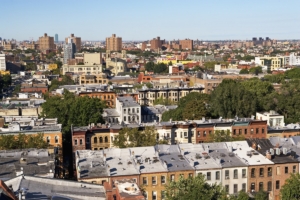
Queens Prices Fall to 2016 Levels
Queens was the only borough analyzed to see a drop in its median asking price. In January, the median asking price of a Queens home was $584,000 — 5.7% lower than last January, and the lowest since October 2016. There were 392 contracts signed in Queens in January, up slightly from 360 signed in December 2021 and up 13.3% since January of last year.
Similar to Brooklyn and Manhattan, for-sale inventory also dropped in Queens, but the 2.7% drop was much smaller than what the other boroughs experienced. There were 3,013 Queens homes for sale in January, up slightly from 2,933 homes in December 2021. Relative to Manhattan and Brooklyn, Queens’ inventory has remained relatively stable throughout the pandemic.
View all StreetEasy Market Reports for Manhattan, Brooklyn, and Queens, with additional neighborhood data and graphics. Definitions of StreetEasy’s metrics and monthly data from each report can be explored and downloaded via the StreetEasy Data Dashboard.
Editor’s Note: In March 2020, New York City’s housing market temporarily froze as the COVID-19 pandemic began in the U.S. in earnest. In 2021, the real estate market roared back to life, with demand returning to both the rentals and sales markets. Year-over-year data comparisons over the next few months will be made against the housing recovery that began at the beginning of 2021. Assuming 2022 is more typical of a “normal” year in housing than 2020 or 2021 were, with times of little to no activity followed by massive spikes in demand, we expect many of our year-over-year measures will show significant losses over last winter and spring. We urge you to use caution in extrapolating too much from year-over-year measures in the coming months, and we will always try to provide appropriate context to anchor reported changes in metrics to what is normal or expected.