The StreetEasy Price and Rent Indices provide an informative way to understand how the New York City real estate market has changed over time. With prices and rents continuing to set record highs in 2015, many New Yorkers might be asking themselves, “just how long will this last?” To answer this question, StreetEasy developed a way to forecast out 12 months the Price and Rent Indices. Using a mix of fundamental factors that affect the real estate market, time series models and careful accuracy evaluations, we created forecasts that were within the average annual change in the forecasted index. The forecasts provide useful insight into what the market may look like in a year’s time.
Methodology
The StreetEasy indices forecasts were created to provide a year ahead outlook for the New York City real estate market. The forecasts were made using an ensemble model, which is a combination of two models, where the ensemble of the two models is made in a way that minimizes out of sample forecast error. The two models used were a leading indicator economic model (LIEM) and a time series model (TSM).
The LIEM is based on the economic model in the paper by Capozza, Hendershott, and Mack (2004) and allows for a long-term mean reversion of prices and serial correlation, which are characteristics often found in the illiquid real estate market.
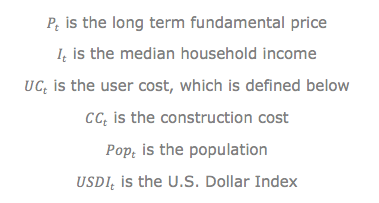
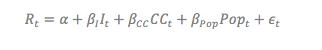
The model is based on the assumption that prices change in accordance with changes in fundamental factors that affect the real estate market. In the original implementation, these factors included household income, population growth and construction costs. In this implementation, the Price Indices forecast adds user costs and because New York City is a first tier international city, a trade weighted U.S. Dollar Index for major currencies is also added.
These factors are represented by the following equation for the Price Indices:

Where
User cost is defined as
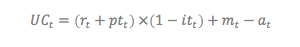
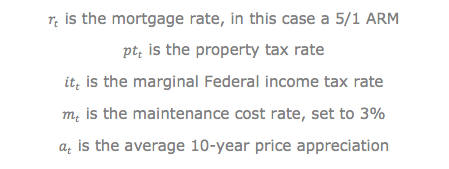
Where
The Rent Indices drop the user cost and U.S. Dollar Index parameters and uses the following equation:
For both indices, the model was fit with exponentially weighted factors.
The TSM is an exponential smoothing state space model, with optimal trend dampening and seasonal adjustments. The models were applied with the ‘forecast’ software package in R (Hyndman, 2014). The application of the TSM model was used for both the indices and for the factors used in the LIEM. Given that median household income often lags the current date by approximately one year, a forecast for it was created using the employment cost index (ECI), which is described here.
The ensemble model is created from the LIEM and the TSM such that the out of sample forecast error is minimized. For each index, the training period of the models is less than half of the initial subset of the historical data, while the errors are evaluated against the later and longer subset of the historical data.
The data was collected from several sources in November 2015. New York City Department of Finance recorded sales documents were used for the Price Indices and the average 10-year price appreciation. Rental listings from StreetEasy provided the basis for the Rent Indices. Annual population numbers for each of the five boroughs from the year 2000 came from the U.S. Census, as did the median household income for each of the five boroughs. Building costs were derived from a national building cost index and fitted to equal approximately $250 per square foot for 2014. For the mortgage rate, a 5/1 adjustable rate mortgage quote for New York City from an online mortgage quote aggregator was used. The marginal Federal income tax rate from NBER was used. The Class 2 property tax rate from the New York City Department of Finance was also used. Where possible, the most local data available was used in the forecast.
The data was aggregated into the software package R, where the models were applied to generate the forecasts for each of the rent and price indices. The method was validated using historical subsets of the data to make forecasts, which were then checked for accuracy against the appropriate historical price or rent index value.
Results
The accuracy of the forecast was evaluated over several years of existing historical index data for all boroughs and their sub-markets. The Price Indices forecast error was on average 15 percent smaller than the average yearly change in the respective index. The forecast error for the Rent Indices was over 50 percent smaller than the average yearly change in the actual index. Given that the forecast error is less than the average year-over-year change, the forecast appears to be sufficiently accurate to provide a useful outlook for the coming year.
The average absolute error for the Price Indices forecast is shown in the table below:
| Area | YoY Change | Error | Area | YoY Change | Error |
| Manhattan | 5.8% | 4.7% | Brooklyn | 6.1% | 5.1% |
| All Downtown | 6.7% | 5.4% | North Brooklyn | 10.8% | 9.8% |
| All Midtown | 5.5% | 4.5% | Northwest Brooklyn | 5.9% | 5.5% |
| All Upper West Side | 5.6% | 4.4% | Prospect Park | 6.7% | 5.7% |
| All Upper East Side | 5.6% | 4.8% | South Brooklyn | 5.5% | 4.5% |
| All Upper Manhattan | 7.4% | 7.9% | East Brooklyn | 16.2% | 12.8% |
For the Rent Indices, the average absolute error is shown in the table below:
| Area | YoY Change | Error | Area | YoY Change | Error |
| Manhattan | 4.0% | 1.3% | Brooklyn | 5.0% | 0.7% |
| All Downtown | 4.3% | 1.8% | North Brooklyn | 7.9% | 1.1% |
| All Midtown | 4.0% | 1.0% | Northwest Brooklyn | 3.8% | 1.9% |
| All Upper West Side | 3.9% | 1.1% | Prospect Park | 5.5% | 2.3% |
| All Upper East Side | 4.4% | 1.5% | South Brooklyn | 5.5% | 4.9% |
| All Upper Manhattan | 5.3% | 5.4% | East Brooklyn | 7.1% | 5.7% |
Conclusion
The forecast methodology described here helps extend the utility of the indices by providing an effective way to find out what the city’s real estate market may look like in a year’s time. With the Price Indices for Manhattan and Brooklyn increasing or decreasing by an average of around 6 percent a year, the forecast has been accurate to within that expected change. For the Rent Indices, with an average annual increase or decrease of 4 percent in Manhattan and 5 percent in Brooklyn, the forecast of those has been accurate to 1.3 percent and 0.7 percent, respectively. For context, the average annual change of the median household income in these boroughs is plus or minus 4.5 percent and 3.5 percent, for Manhattan and Brooklyn, respectively.
As prices and rents in these boroughs reach new record highs, the forecast provides a useful outlook on how the real estate market in New York City may look to its 8 million inhabitants next year.
References
Capozza, D., Hendershott, P. and Mack, C. (2004), “An Anatomy of Price Dynamics in Illiquid Markets: Analysis and Evidence from Local Housing Markets,” Real Estate Economics.
Hyndman, R. with Razbash, S. and Schmidt, D. (2014), “forecast: Forecasting functions for time series and linear models,” R package version 5.6, http://CRAN.R-project.org/package=forecast