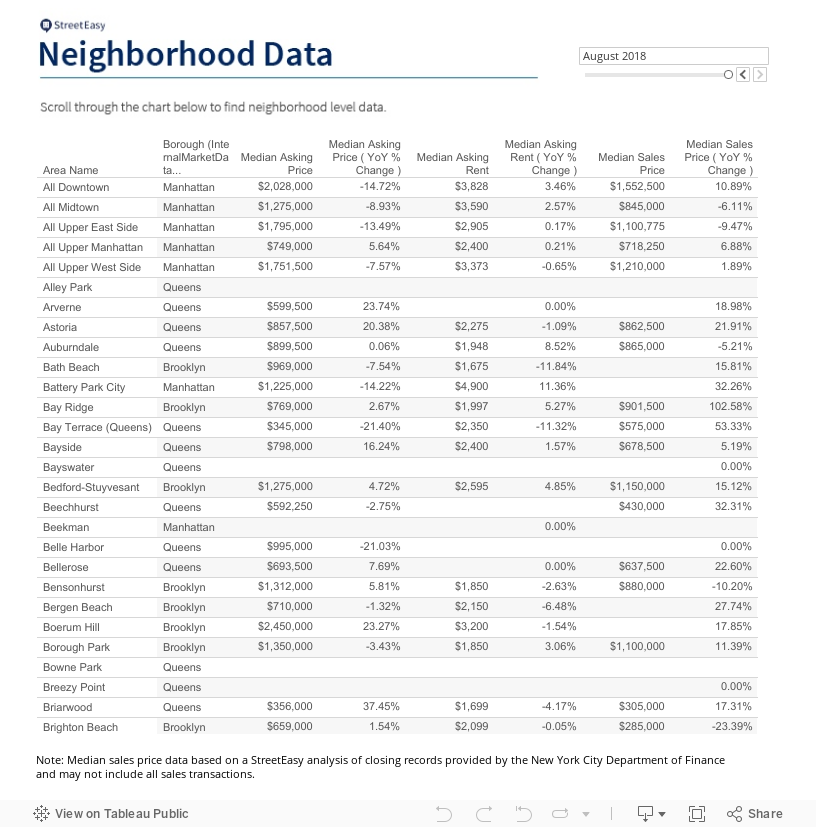
Home prices in Queens rose 7.1 percent since last year, reaching a new high of $536,028, according to the August 2018 StreetEasy Market Reports[i]. Home prices in Queens are now 23 percent higher than they were in 2013, driven largely by the overwhelming demand for affordable homes across the city.
Despite the fast pace of price growth, Queens remains relatively affordable compared to Manhattan and Brooklyn where prices were stagnant at $1,154,908 and $726,874, respectively. Queens also had the highest share of price cuts in the city at ten percent, up 3.4 percentage points over last year. Queens homes moved off the market quickly, selling after a median of 62 days, more than a month faster than the 99 days homes spent on the market in Manhattan.
“Queens was hit hard by the financial crisis and had a slower recovery from the recession, but now both inventory levels and prices are on the rise,” says StreetEasy Senior Economist Grant Long. “Although demand for homes in the borough is up, home shoppers will continue to find good value and a lot of options. Buyers should remain confident and be prepared to negotiate.”
See below for additional rental and sales market trends across Manhattan, Brooklyn and Queens.
August 2018 Key Findings — Manhattan
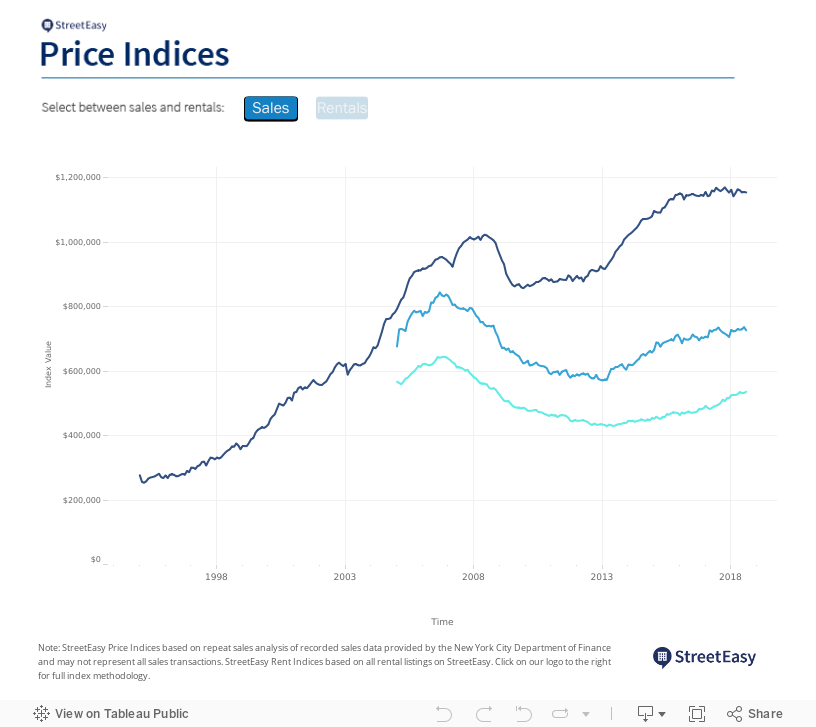
- Sales prices have plateaued. The StreetEasy Manhattan Price Index[ii] dipped 0.3 percent year-over-year to $1,154,908. Prices in Upper Manhattan[iii], the least expensive submarket, rose 3.4 percent, reaching a new high of $552,516.
- There are now over 1,000 more homes on the market than there were at this time last year. Over the summer, total sales inventory in Manhattan dipped since hitting record levels this spring. The pace of growth is still rising, however, with inventory levels across the borough up 16.6 percent year-over-year.
- Eight percent of homes had their prices cut. The share of sales with price cuts was up 1.8 percentage points year-over-year following an influx of new inventory. Buyers were more likely to find price cuts in Upper Manhattan and the Upper West Side[iv] where nine percent of homes had their prices cut in August.
- Rents reached an all-time high. The StreetEasy Manhattan Rent Index[v] reached an all-time high of $3,240, an increase of 1.9 percent over last year.
- Nearly 16 percent of rentals advertised concessions. The share of rentals with concessions[vi] rose 6.1 percent in the past month, but dropped 1.1 percentage points since last year. Renters were more likely to find concessions in Midtown[vii] where 22.6 percent of rentals offered a concession – up 1.7 percentage points from last year.
August 2018 Key Findings — Brooklyn
- Home prices stagnated since last year. The StreetEasy Brooklyn Price Index remained unchanged from the previous year at $726,874. North Brooklyn[viii], the most expensive submarket, saw a price increase of 1.6 percent reaching $1,157,295.
- Inventory rose across the borough, except in North Brooklyn. Sales inventory increased 14 percent annually in Brooklyn. North Brooklyn was the only submarket to experience a dip in inventory, down 8.3 percent compared to this time last year.
- North Brooklyn homes sold one month faster. North Brooklyn homes spent a median of 70 days on the market – 30 days less than August 2017.
- Rents reached an all-time high. The StreetEasy Brooklyn Rent Index rose 1.4 percent from last year to an all-time high of $2,605.
- The number of rentals offering concessions fell. The share of rentals with concessions dropped 1.7 percentage points since last year, with 13.5 percent of units advertising concessions in August.
August 2018 Key Findings — Queens
- Prices continued to rise. The StreetEasy Queens Price Index rose since last summer, following the same pattern since 2013. Prices rose 7.1 percent year-over-year to $536,028.
- Sales inventory reached its second highest level. Queens inventory reached near peak level, rising 4.7 percent from last year. Despite the gains, the rate of growth is still slower than that of Manhattan and Brooklyn.
- Queens saw the highest share of price cuts. The share of for-sale homes offering price cuts rose 3.4 percentage points, reaching 10.2 percent.
- Rents rose slightly. Queens rents saw a slight 0.5 percent increase in August with the StreetEasy Queens Rent Index reaching $2,164. This was the first time the borough experienced an annual increase in rents since September 2017.
- The share of rentals advertising concessions fell. 12 percent of rentals in Queens advertised concessions in August, down 4.8 percentage points compared to last year.
The complete StreetEasy Market Reports for Manhattan, Brooklyn and Queens, with additional neighborhood data and graphics, can be viewed at streeteasy.com/blog/research/market-reports/. Definitions of StreetEasy’s metrics and monthly data from each report can be downloaded at streeteasy.com/blog/download-data/.
[i] The StreetEasy Market Reports are a monthly overview of the Manhattan, Brooklyn and Queens sales and rental markets. Every three months, a quarterly analysis is published. The report data is aggregated from public recorded sales and listings data from real estate brokerages that provide comprehensive coverage of Manhattan, Brooklyn and Queens, with more than a decade of history for most metrics. The reports are compiled by the StreetEasy Research team. For more information, visit https://streeteasy.com/blog/research/market-reports/. StreetEasy tracks data for all five boroughs within New York City, but currently only produces reports for Manhattan, Brooklyn and Queens.
[ii] The Upper Manhattan submarket includes Central Harlem, East Harlem, Hamilton Heights, Inwood, Manhattanville, Marble Hill, Washington Heights and West Harlem.
[iii] The Upper West Side submarket includes Lincoln Square, Manhattan Valley, Morningside Heights and the Upper West Side.
[iv] The StreetEasy Rent Indices are monthly indices that track changes in rent for all housing types and are currently available from January 2007 in Manhattan, January 2010 in Brooklyn and January 2012 in Queens. Each index uses a repeat-sales method similar that used to calculate the StreetEasy Price Indices. The repeat method evaluates rental price growth based on homes in a given geography that have listed for rent more than once. More details on methodology here.
[v] Concessions are defined as advertised, temporary price reductions in the form of one or more months of free rent. StreetEasy does not include non-traditional concessions, such as Netflix packages and discounted amenities. We also did not include the waiving of broker’s fees as concessions.
[vi] The Midtown Manhattan submarket includes Roosevelt Island, Midtown, Central Park South, Midtown South, Midtown East and Midtown West.
[vii] The North Brooklyn submarket includes Greenpoint, Williamsburg and East Williamsburg.
[viii] The Northwest Brooklyn submarket includes Downtown Brooklyn, Fort Greene, Brooklyn Heights, Boerum Hill, DUMBO, Red Hook, Gowanus, Carroll Gardens, Cobble Hill, Columbia St. Waterfront District and Clinton Hill.
[ix] The Central Queens submarket includes Woodside, Jackson Heights, East Elmhurst, North Corona, Elmhurst, Corona, Maspeth, Middle Village, Ridgewood, Glendale, Rego Park and Forest Hills.