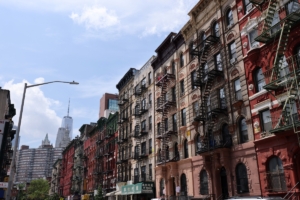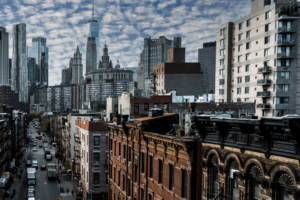


COVID-19 and NYC rents: The pandemic struck hardest in areas already bearing the brunt of the city’s affordability crisis. (Getty Images)
Key Findings:
- The COVID-19 pandemic had the most impact in NYC neighborhoods that were already experiencing the greatest rent burden, according to new StreetEasy research.
- In neighborhoods that saw the most COVID-19 cases in 2020, rents rose 22% over the last six years. In areas with the fewest COVID-19 cases, rents rose only 10% over the last six years.
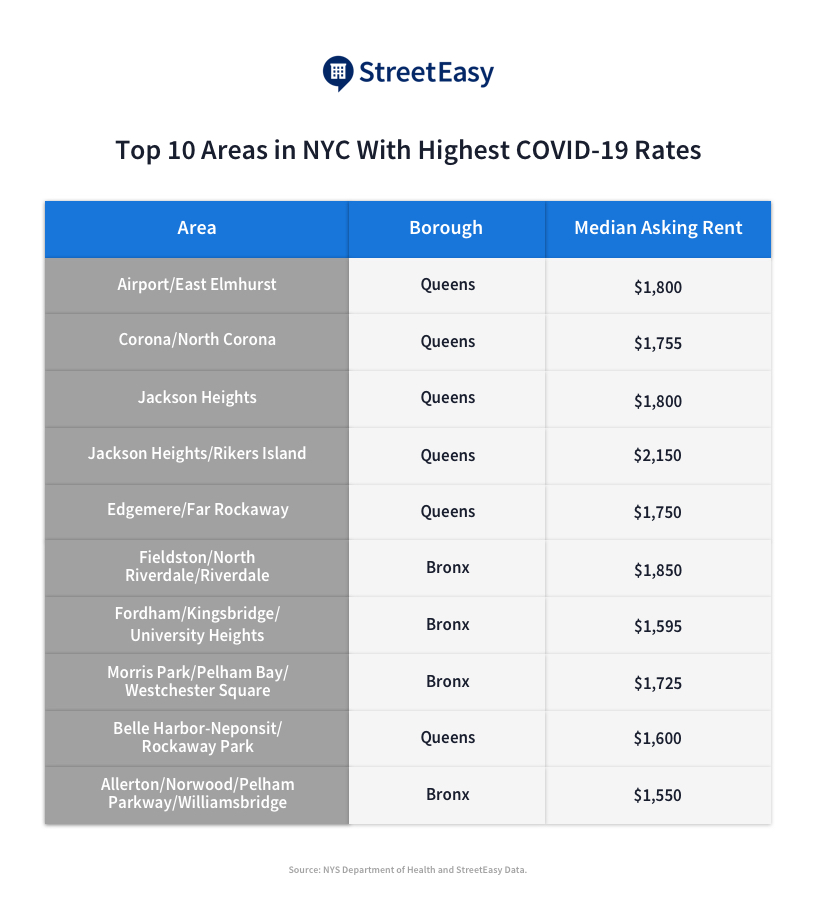
- The areas most impacted by the pandemic, including Elmhurst, Corona, and Jackson Heights, have more overcrowding and see more evictions than other areas, according to NYU’s Furman Center. They’re also home to more immigrants, Black and Hispanic New Yorkers, and those on lower incomes.
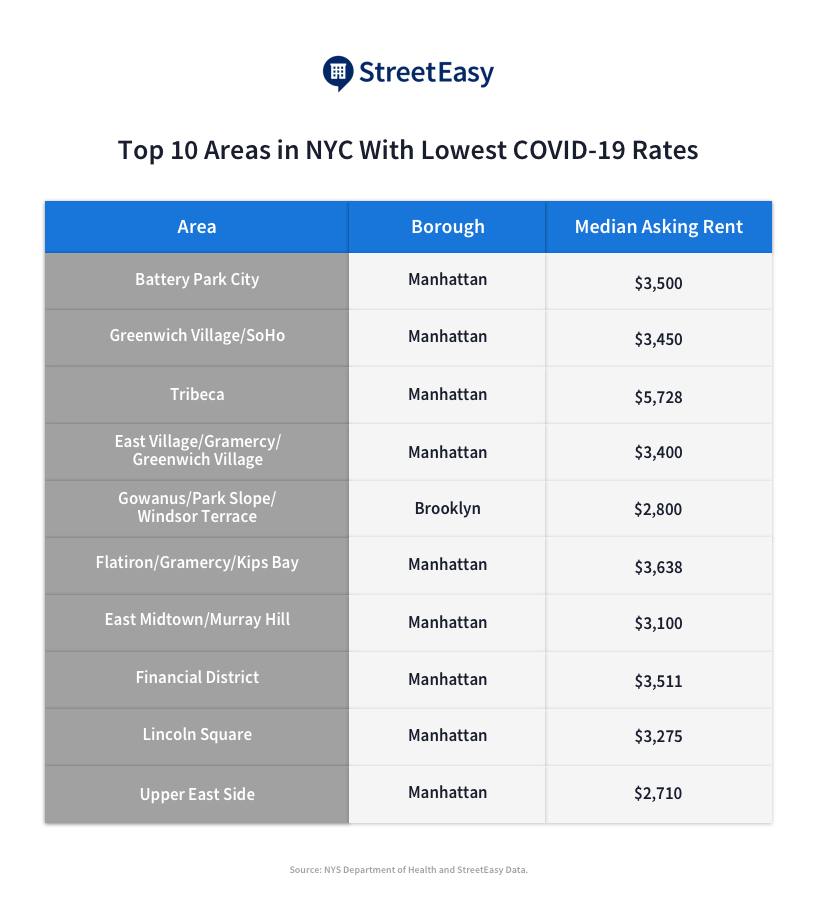
- By contrast, NYC neighborhoods least affected by COVID-19 were Manhattan areas like the West Village and Battery Park City, with higher but more slowly growing rents.
- Since this spring, the differential in rent growth between neighborhoods with relatively many and relatively few COVID-19 cases has only grown. Rents in the least-impacted areas have fallen by 1.9%, while rents in the most-impacted areas have continued to rise slowly, by 0.3%.
- StreetEasy will be hosting a virtual event, “Addressing Housing Affordability During COVID-19,” on Tuesday, Sept. 15, at 2 p.m. EST to discuss these findings and the disparate effects of COVID-19 across the city. Register now to attend.
~
As the rate of new COVID-19 cases has slowed in New York City, relief from the city’s high rents has come to some neighborhoods — but not to many others.
A new analysis of citywide rent affordability from StreetEasy finds that the neighborhoods at the epicenter of the virus outbreak also bore some of the greatest impacts of New York’s housing affordability crisis. And they’re still bearing it.
Our data reveals that in the six years prior to COVID-19, rents in the areas most affected by the pandemic grew at twice the rate of rents citywide. Since this spring, rents in these areas have continued to grow — while those in the neighborhoods least impacted by COVID-19 have started to decline.
The neighborhoods most impacted by the COVID-19 pandemic are outer-borough areas far from Manhattan, such as Elmhurst, Corona, and Jackson Heights. Meanwhile, the neighborhoods least affected by COVID-19 are some of the most expensive in Manhattan, such as Battery Park City and West Village.
In the neighborhoods that escaped the pandemic’s worst impacts, historically high rents have begun to come down, and vacancy rates are rising. Yet in the neighborhoods where COVID-19 was most strongly felt, the very opposite is true.
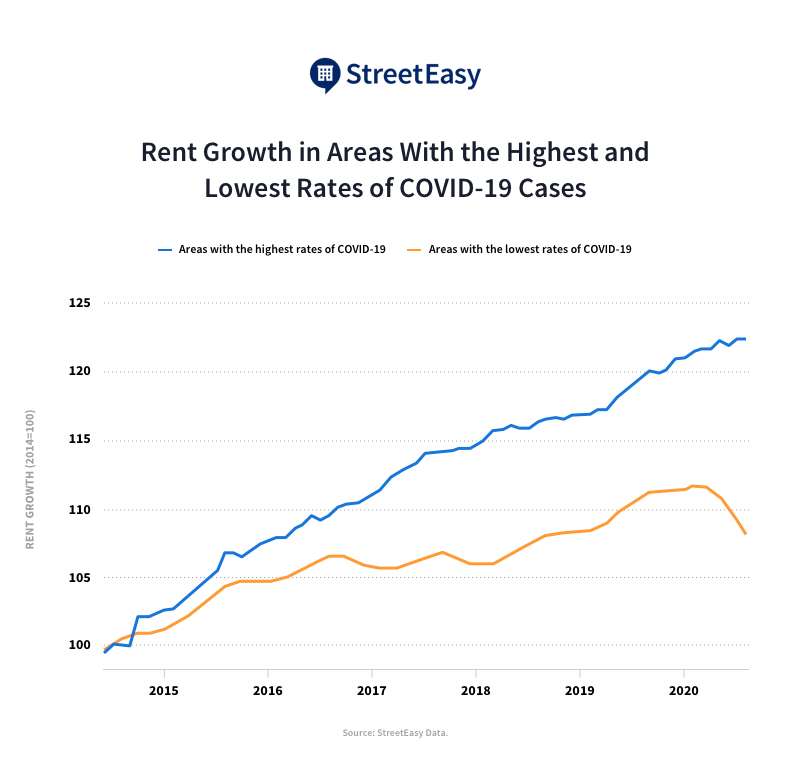
Rents Have Grown Twice as Quickly in Areas COVID-19 Hit Hardest
Between July 2014 and July 2020, rents in the zip codes that would be most affected by COVID-19 rose by 22%. That’s twice the rate of the city overall, where rents grew 11%. In what would turn out to be low-COVID-19 zip codes, rents rose by 10% in the same period.
Many factors are at play here. For one, the median rent in the areas most affected by COVID-19 was $1,760, compared to $3,475 for the least-affected areas. As we showed in our 2018 report on rent affordability, rents in neighborhoods with lower median prices tend to grow faster than those in higher-priced neighborhoods.
However, there are many factors that make this growing rent burden more than a numbers game. According to research by the NYU Furman Center for Real Estate and Urban Policy, the most impacted neighborhoods have lower population density, more limited housing stock, higher rates of overcrowding, higher rates of renters experiencing moderate and severe rent burden, and higher eviction filing rates.
Overcrowding is one consequence of the rent affordability crisis, and a factor that exacerbates coronavirus case rates. In fact, the Furman Center has found that the most overcrowded neighborhoods — neighborhoods with an average of 1.5 or more people per room per household — had the highest rates of COVID-19 cases in New York City.
The Cost of Moving and the Affordability Crisis Led to Overcrowding
In the years leading up to the pandemic, New York City experienced the longest and largest job expansion since the end of World War II. Rapid population growth led to more competition for affordable rentals among a limited stock of homes. As a result, household sizes expanded: the lower a family’s income, the more severe overcrowding became. Leading up to the pandemic, rents hit record highs across the city after rising nonstop, year over year, for a decade.
“Our research showed that it’s not the number of people per square mile, but the number of people per room that is most associated with the spread of the pandemic,” says Charles McNally, the director of external affairs at NYU’s Furman Center. The national research since then has supported that sustained time in indoor, crowded spaces is the most common way COVID-19 spreads.
The costs of moving — security deposits, movers, furniture — make it more difficult for residents who are already rent-burdened to move to a more affordable neighborhood when rents rise. In contrast, renters in more affluent neighborhoods are more likely to leave their neighborhoods once their leases expire and move to a more affordable area.
Moreover, the neighborhoods that were most affected by COVID-19 are home to large populations of recent immigrants, higher shares of Black or Hispanic residents, and New Yorkers earning lower median incomes than less-affected neighborhoods. “There are informal networks that are important to people (recent immigrants) to adapt to life in a new country, and these networks tend to keep people in the neighborhoods where they first relocate,” McNally says.
The Disparate Impacts of COVID-19, Rents, and Unemployment
Since COVID-19 hit the city, the gap in rent growth between the most- and least-impacted neighborhoods has widened even further. Between February and July 2020, rents in the zip codes most affected by COVID-19 continued to rise slowly, by 0.3%, while rents in low-COVID zips fell by 1.9%.
The neighborhoods least impacted by COVID-19, such as the Financial District and Midtown, experienced some relief as people left Manhattan for elsewhere, leading to high vacancy rates and lower rents. Rental inventory in July 2020 increased by 65% in Manhattan, the biggest year-over-year jump since StreetEasy started tracking this figure in 2010. More inventory on the market as New Yorkers flee the city means lower rents for those who stay. But while price drops are generally good news for renters, those hoping to find a good deal in Manhattan are likely not at the highest risk of housing insecurity.
In neighborhoods with the highest rates of COVID-19 cases, residents bear a disproportionate burden of both rising rents and unemployment. As of July 2020, New York City had an unemployment rate of 19.9%. However, the neighborhoods most impacted by COVID-19 are also those with the most renters who work in professions most vulnerable to job loss, such as hospitality and services. The job losses resulting from the pandemic have only made it more difficult to pay for living expenses.
“There is a Manhattan-centric narrative and a ‘rest of the boroughs’ narrative,” says Barika Williams, director of the Association for Neighborhood and Housing Development (ANHD).
Unemployment is likely to stay high as long as the coronavirus pandemic remains a public health threat. Reduced travel and the risk of large gatherings will continue to take a toll on the many New Yorkers who work in service and hospitality jobs.
Where Do We Go from Here?
In September, the Centers for Disease Control announced a national ban on evictions for renters who have lost income due to COVID-19. This move will be crucial for preventing renters from losing their homes in the midst of a pandemic, as well as preventing more overcrowding.
Without federal funding for the missed payments, however, the eviction moratorium still makes unclear who will bear the burden of the missed rent when the time comes to pay. According to Williams, there’s no path to recovery without future rental assistance or relief, whether that’s rent cancellation or income subsidies. “We’re talking about people in the community who don’t have more than $400 to cover an unexpected cost,” Williams says.
One of the most crucial and protective programs to date has been the enhanced unemployment benefits made available by the CARES Act, which expired in July. The CARES Act nearly replaced the lost employment income for households who were able to benefit from this federal assistance. “Without this extra $600 per week in assistance, it is likely that we will see devastating consequences, especially for lower-income renters,” McNally says.
For now, New York City has entered Phase 4, its last phase of reopening, and the rate of new cases in NYC has been flattening. But the disparate effects across the city of both COVID-19 and the rent affordability crisis reveal a tale of two cities, with ongoing inequalities that will last well beyond the pandemic.
To discuss this report and learn more about StreetEasy research, attend “Addressing Housing Affordability During COVID-19,” a virtual event featuring economist and report author Nancy Wu in conversation with the Furman Center’s Charles McNally and housing advocate Barika Williams. The talk will take place from 2-3 p.m. on Sept. 15. Register now to attend.
How We Did It
Data came from the NYC Department of Health data on coronavirus cases by zip code and rentals on StreetEasy.
This analysis leverages more than a million rental listings on StreetEasy. We used an advanced statistical process that builds on the methodology behind the StreetEasy Rent Index, customized for zip codes in the city that were most and least impacted by COVID-19. The rent indices are monthly indices that track changes in rent for all residential housing types in New York City on the market, not including public or subsidized housing. These customized Rent Indices provide an angle on rent growth that is not captured by looking at market medians, and is less susceptible to bias from the types of units available at a given time. Each index uses a repeat-rents method.
The custom rent index is indexed to July 2014=100. For example, an increase to 115 in 2015 means a 15% increase in rents since July 2014. The indices are split between zip codes with the highest versus lowest rate of coronavirus cases per 1 million people. We defined the cutoff zip codes as the top and bottom zip codes with the highest and lowest case rate with the population denominator adding to 1 million people, respectively.
—
Whether you’re looking to rent or to buy, find your next NYC apartment on StreetEasy.