October 2026 NYC housing market report
Key takeaways:
- As high mortgage rates raised the bar for NYC buyers, homes entering contract fell 7.9% year-over-year in October, but the decline was more modest than the 16.8% drop in the national market.
- Limited inventory has been the most substantial challenge for buyers, with homes on the market falling to the lowest level for October since 2017.
- As competition increased, 21.0% of NYC homes sold above asking in October, up from 18.9% a year ago.
- With 20% down at current mortgage rates, it would take 14.5 years for an NYC buyer to pull ahead of a renter financially, up from 12.4 years in 2025.
- In five neighborhoods where rising rents reduced the gap between sale prices, a new homeowner could pull ahead of a renter in under five years.
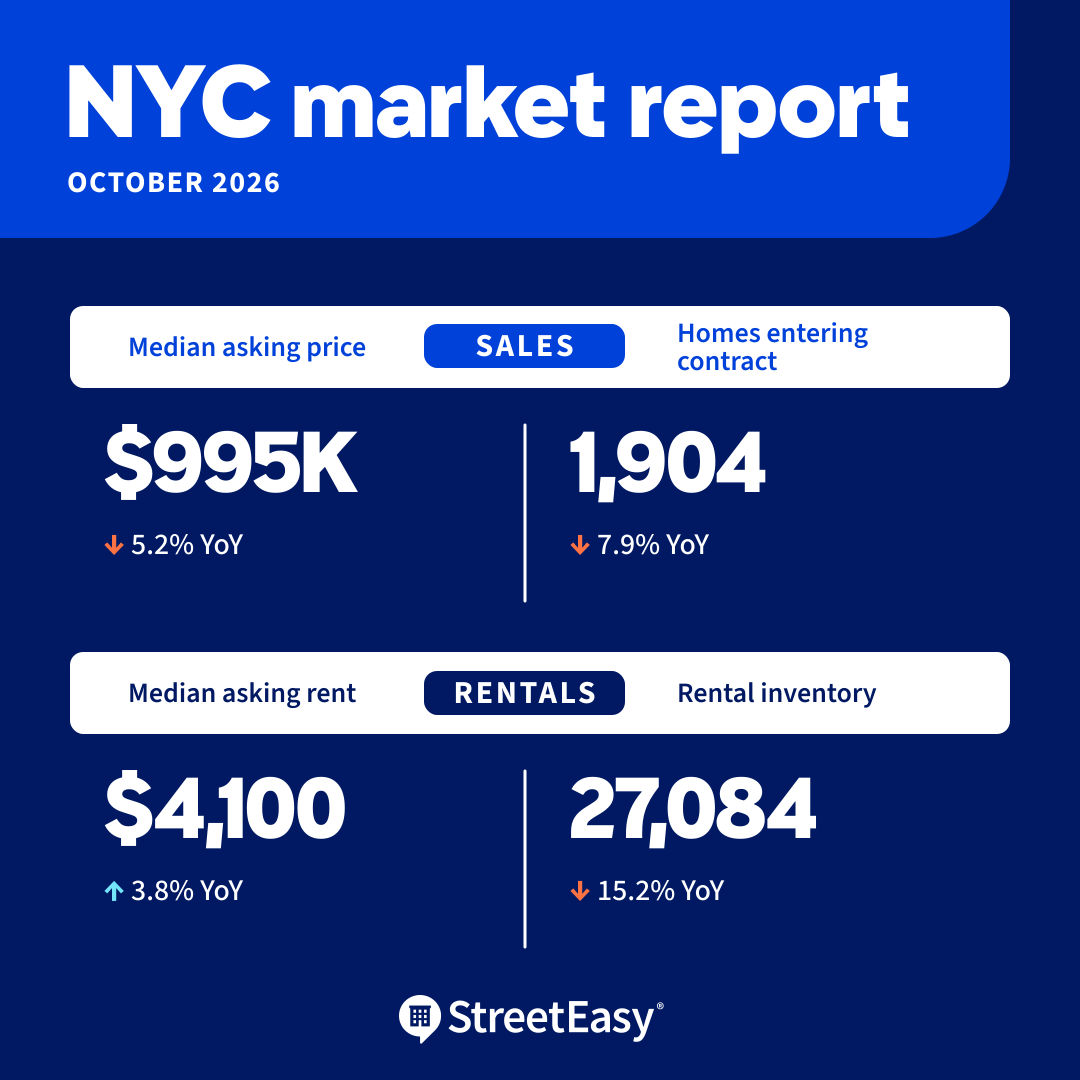
Sharp increases in mortgage rates weighed on market activity in October, with 7.9% fewer homes entering contract than a year ago in NYC. However, the slowdown in NYC was far more modest compared to the 16.8% drop across the national market, according to Zillow data.
Across the city, 1,904 homes entered contract, 15.8% above the October 2023 level, the last time rates stayed persistently above 7%. By comparison, new contracts nationwide dipped 4.6% below the October 2023 level.
But mortgage rates may not be the biggest factor impeding sales in NYC this fall. Strong sales through this summer have drained inventory, leaving buyers little room to negotiate with sellers. In October, inventory fell 3.1% year-over-year to 17,496 — the lowest for the month since 2017.
As a result, homes sold for a median of 97.8% of their latest asking price in October, about the same as October of last year. As competition increased, 21.0% of NYC homes sold above asking in October, up from 18.9% a year ago. Despite the slowdown in new contract volume, homes entering contract spent a median of just 48 days on the market, down 15 days from a year ago and fastest since May 2022.

Buying can make financial sense even with rates above 7%
Despite the recent surge in mortgage rates, buying can still pay off in NYC. At the citywide median sale price of $900,000 in October, a buyer with 20% down would pull ahead of renters financially in 14.5 years, up from 12.4 years a year ago. Higher mortgage rates and sale prices added two years to buyers’ breakeven point: when the financial benefits of owning surpass the benefits of renting.
There are good reasons to keep renting, such as having the freedom to move at the end of a lease and avoiding property taxes and maintenance responsibilities. Moreover, preparing a down payment requires significant savings, and renters may invest this cash into other financial assets. For many New Yorkers, flexibility and lower financial barriers are necessities.
However, elevated rents can erode the advantage of renting over a longer horizon. The median asking rent in NYC increased 3.8% year-over-year to $4,100 in October. The city’s housing shortage has been fueling rent growth, which can strengthen the financial case for those with enough savings to consider becoming a homeowner.
NYC homes under $1M on StreetEasy Article continues below



Renters’ edge evaporates quickly in neighborhoods where rents are high relative to sale prices
Buyers can reach the breakeven point sooner in neighborhoods with smaller gaps between asking rents and sale prices, and with rent growth often outpacing sale price growth. In five neighborhoods — Rego Park, Oakland Gardens, Riverdale, Kew Gardens Hills and Forest Hills — new homeowners could come out ahead of renters financially in fewer than five years.
Under current market conditions, Rego Park had the shortest buy-versus-rent breakeven period at 2.8 years. Rego Park’s median sale price in October was $330,000 and its median asking rent was $2,999, putting the purchase price at 9.2 times the annual rent.

Brooklyn Heights was a surprising standout with a breakeven point of 6.8 years. Its median sale price was $870,000 in October, equivalent to 14.1 times the annual rent based on its median asking rent of $5,150. Strong asking rent growth in Brooklyn Heights shortened the time it would take for a buyer to pull ahead financially.
Gramercy Park ranked ninth for the earliest breakeven window, despite having the highest median sale price among the 10 neighborhoods at $962,500. A new homeowner could overtake a renter in the same neighborhood within 7.2 years, about half as long as the citywide breakeven point. The high cost of renting, with a median asking rent of $5,000 in October, kept this neighborhood within the top 10.
Neighborhoods where buyers can pull ahead of renters the fastest
| Borough | Neighborhood | Median sale price in October | Median asking rent in October | Sale price to annual rent ratio (years) | Buy vs. rent breakeven (years) |
|---|---|---|---|---|---|
| Queens | Rego Park | $330,000 | $2,999 | 9.2 | 2.8 |
| Queens | Oakland Gardens | $349,000 | $2,750 | 10.6 | 3.4 |
| Bronx | Riverdale | $400,000 | $3,275 | 10.2 | 3.9 |
| Queens | Kew Gardens Hills | $367,500 | $2,450 | 12.5 | 4.3 |
| Queens | Forest Hills | $387,000 | $2,989 | 10.8 | 4.6 |
| Queens | Jackson Heights | $425,000 | $2,675 | 13.2 | 6.1 |
| Queens | Woodside | $475,000 | $3,225 | 12.3 | 6.5 |
| Brooklyn | Brooklyn Heights | $870,000 | $5,150 | 14.1 | 6.8 |
| Manhattan | Gramercy Park | $962,500 | $5,500 | 14.6 | 7.2 |
| Brooklyn | East Flatbush | $595,000 | $3,000 | 16.5 | 7.3 |
Expect a busy end to 2026
Despite modest declines from their recent peak, mortgage rates will likely remain elevated through this year and potentially next spring. However, financially ready buyers can still make the math work, particularly in neighborhoods where they can reach breakeven sooner. Combined with limited inventory, well-priced homes will continue to see strong competition.
The silver lining for buyers is the surge of new listings in NYC. In October, 3,538 homes hit the market, following 4,952 homes newly listed for sale in September — the highest in four years. The increase in new listings means more choices for those planning to buy this fall. For sellers, strong visibility and buyer engagement early in the marketing period is crucial for success, especially under current market conditions.
Meanwhile, the rental market is poised to heat up this winter. As additional would-be buyers bide their time as renters, vacancy rates will likely remain low. In October, the city’s rental inventory fell 15.2% from a year ago to 27,084 units. In Manhattan, inventory fell 17.3% to 11,662 homes. As renters compete for limited available homes, rent growth is set to accelerate in NYC.
NYC rentals under $3,500 on StreetEasy Article continues below




NYC market data: October 2026
Sales
 NYC |
 Manhattan |
 Brooklyn |
 Queens | |
|---|---|---|---|---|
| Median asking price | $995,000 (-5.2% YoY) | $1,375,000 (-5.2%) | $1,000,000 (-9.0%) | $689,000 (+1.4%) |
| Number of homes for sale | 17,496 (-3.1%) | 8,456 (-9.1%) | 4,539 (+2.2%) | 3,373 (+5.4%) |
| Homes entering contract | 1,904 (-7.9%) | 936 (-7.4%) | 521 (-4.6%) | 337 (-8.4%) |
| Median days on market | 48 (-15) | 43 (-25) | 48 (-3) | 60 (-9) |
Rentals
|
NYC |
Manhattan |
Brooklyn |
Queens | |
|---|---|---|---|---|
| Median asking rent | $4,100 (+3.8% YoY) | $4,995 (+8.6%) | $3,866 (+3.1%) | $3,350 (+4.7%) |
| Number of homes for rent | 27,084 (-15.2%) | 11,662 (-17.3%) | 9,924 (-15.9%) | 4,398 (-5.7%) |
| Share of rentals with price cuts | 16.5% (-2.4pp) | 21.0% (-3.4pp) | 13.5% (-2.2pp) | 14.2% (-1.0pp) |
| Share of rentals offering concessions* | 18.4% (-4.1pp) | 15.3% (-5.3pp) | 20.2% (-3.3pp) | 19.7% (-1.2pp) |
Methodology
To calculate when buying pulls ahead of renting financially, we followed the same methodology as Zillow’s calculations while using StreetEasy data relevant to NYC.
We assume a buyer purchases a home with a fixed-rate 30-year mortgage and 20% down payment, in addition to homeownership costs including mortgage payments, property taxes, insurance, maintenance, and closing costs at both purchase and sale. Over time, buyers build equity as they pay down the loan, and home value grows at the rate of its long-term trend in their local market.
As an alternative, a renter pays monthly rent and renter’s insurance, but invests the money they would have spent on a down payment and closing costs. Rent growth is assumed to follow the local market’s long-term trend, and their investment to grow at a conservative risk-free rate over 30 years.
We then compare the financial trajectory of homeownership to renting over 30 years, discounted to present values. The breakeven point is when the buyer’s net financial position first exceeds that of the renter.
StreetEasy is an assumed name of Zillow, Inc. which has a real estate brokerage license in all 50 states and D.C. See real estate licenses. StreetEasy does not intend to interfere with any agency agreement you may have with a real estate professional or solicit your business if you are already under contract to purchase or sell property. All data for uncited sources in this presentation has been sourced from Zillow data. Copyright © 2026 by Zillow, Inc. and/or its affiliates. All rights reserved.