September 2026 NYC housing market report
Key takeaways:
NYC sales market
- New listings reached their highest level since March 2022, with 4,951 homes newly listed for sale citywide in September: 7.6% higher than a year ago.
- In the aftermath of the strong summer sales season, inventory remained low and buyer competition remained hot, with 21.1% of homes selling above their latest asking price in September.
- Homes entering contract declined 5.4% year-over-year as sharp increases in mortgage rates led some buyers to pause.
NYC rental market
- As rising mortgage rates kept buyers in the rental market, rental inventory fell 15.3% year-over-year in September, the sharpest annual decline in four years.
- The median asking rent in Manhattan remained at $4,995 in September, bucking the typical seasonal decline as summer leasing season comes to a close.
- Competition is spreading beyond Manhattan, with Brooklyn inventory falling 18.4% and Queens inventory down 5.4%.

NYC sales market
Despite sharp increases in mortgage rates since March, NYC sellers rushed into the market in September, looking to leverage strong buyer demand. Across the city, 4,951 homes were newly listed for sale in September, 7.6% higher than a year ago and the highest since March 2022.
In Manhattan, 2,689 new listings joined the market in September, up 6.8% year-over-year. Resale condos drove the increase, with new listings of this type rising 15.8% to 1,054. In contrast, new sponsor condo listings fell 18.0% year-over-year to 155 as the city’s thinner construction pipeline reduced supply, particularly in Manhattan.
The jump in resale listings reflects sellers looking to leverage resilient buyer demand for resale condos. Reflecting this trend, condo-heavy neighborhoods like the Flatiron District and Tribeca took the second and fourth spots among neighborhoods with the largest jumps in new listings.
Long Island City saw the sharpest annual increase in new listings in September with a whopping 205.4% rise, with several new development launches driving the surge. Meanwhile in Brooklyn, Williamsburg added 109 new listings, up 26.7% from a year ago.
NYC neighborhoods with most new listings, September 2026
| Neighborhood | Borough | New listings in September | YoY change in new listings | Median asking price of new listings |
|---|---|---|---|---|
| Long Island City | Queens | 113 | 205.4% | $1,140,000 |
| Flatiron | Manhattan | 99 | 67.8% | $2,725,000 |
| Washington Heights | Manhattan | 54 | 42.1% | $539,500 |
| Tribeca | Manhattan | 81 | 30.7% | $5,100,000 |
| Astoria | Queens | 95 | 28.4% | $999,000 |
| Williamsburg | Brooklyn | 109 | 26.7% | $1,450,000 |
| Brooklyn Heights | Brooklyn | 50 | 25.0% | $1,472,500 |
| Financial District | Manhattan | 103 | 18.4% | $1,250,000 |
| Upper East Side | Manhattan | 603 | 17.5% | $1,395,000 |
| Lower East Side | Manhattan | 57 | 16.3% | $1,275,000 |
Despite sharp increases in new listings across the city, the market still needs more to replenish supply after strong summer sales drained inventory. In September, inventory fell 4.9% from a year ago to 16,737 homes, marking the ninth consecutive month of year-over-year inventory decline since January. As a result, buyer competition remained hot with 21.1% of homes selling above their latest asking price in September, up 1.1pp from a year ago.
Meanwhile, homes entering contract fell 5.4% year-over-year to 1,528 in September, as rising mortgage rates hit buyers’ budgets. New contracts fell 6.8% to 660 in Manhattan and 11.5% to 415 in Brooklyn. Queens was an exception, where new contracts rose 9.3% to 353. As its co-op market continued to show strength, 154 co-ops entered contract in Queens, up 12.4% from a year ago.
NYC homes under $1M on StreetEasy Article continues below
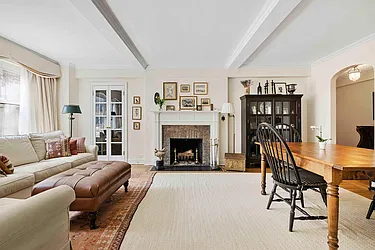
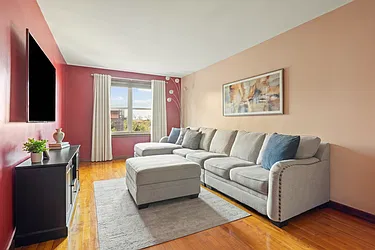
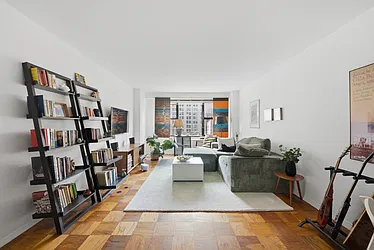
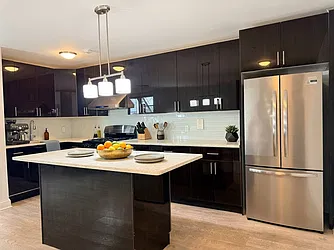



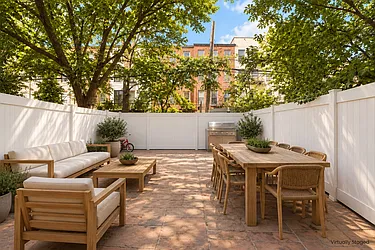



While NYC buyers have been more resilient to rising rates this year than those in the national market, higher borrowing costs still mean fewer buyers can participate. With new contracts slowing, strategic pricing and marketing strategies that maximize visibility and buyer engagement are increasingly important for sellers in NYC. For buyers, acting when others don’t could create additional opportunities, especially while new listings are rising.
NYC rental market
In September, the citywide median asking rent rose 3.9% year-over-year to $4,150, a more modest pace than the 6.5% annual increase in September 2025. However, rising mortgage rates have the potential to make the already-hot rental market even hotter, leading to re-accelerating rent growth.
As more would-be homebuyers bide their time as renters amid rising mortgage rates, fewer homes will likely return to the rental market, deepening the city’s severe housing shortage. Citywide rental inventory fell 15.3% year-over-year to 29,029 units in September, the sharpest annual decline since September 2022.
NYC rentals under $3,500 on StreetEasy Article continues below



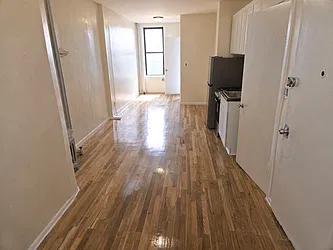
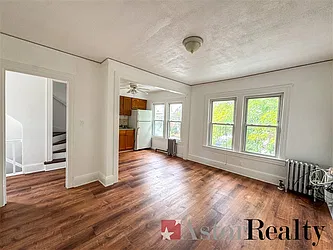

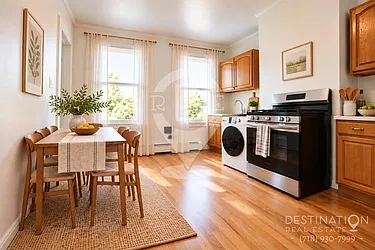
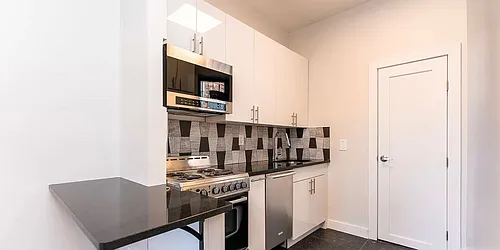
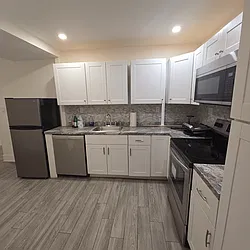
Manhattan, the most competitive borough for renters, saw inventory fall 16.3% to 12,736 homes. With demand outpacing supply, Manhattan’s median asking rent remained at $4,995 in September, defying the seasonal decline after summer. In each of the past two years, the borough’s median asking rent declined between August and September, falling 2.2% in 2024 and 2.6% in 2025.
Competition is spreading beyond Manhattan as renters seek more affordable options. Rental inventory fell 18.4% year-over-year in Brooklyn to 10,758 homes, and 5.4% in Queens to 4,323. The median asking rent rose 3.8% to $3,945 in Brooklyn, and 4.7% to $3,400 in Queens.
NYC market data: September 2026
Sales
 NYC |
 Manhattan |
 Brooklyn |
 Queens | |
|---|---|---|---|---|
| Median asking price | $995,000 (-5.2% YoY) | $1,350,000 (-6.9%) | $1,000,000 (-9.0%) | $698,000 (+1.2%) |
| Number of homes for sale | 16,737 (-4.9%) | 7,957 (-11.7%) | 4,363 (+1.6%) | 3,326 (+4.8%) |
| Homes entering contract | 1,528 (-5.4%) | 660 (-6.8%) | 415 (-11.5%) | 353 (+9.3%) |
| Median days on market | 88 (+14) | 102 (+11) | 77 (+16) | 78 (+11) |
Rentals
|
NYC |
Manhattan |
Brooklyn |
Queens | |
|---|---|---|---|---|
| Median asking rent | $4,150 (+3.9% YoY) | $4,995 (+8.0%) | $3,945 (+3.8%) | $3,400 (+4.7%) |
| Number of homes for rent | 29,029 (-15.3%) | 12,736 (-16.3%) | 10,758 (-18.4%) | 4,323 (-5.4%) |
| Share of rentals with price cuts | 16.0% (-3.9pp) | 19.8% (-4.6pp) | 13.6% (-2.7pp) | 13.7% (-4.4pp) |
| Share of rentals offering concessions* | 17.6% (-1.9pp) | 14.4% (-2.1pp) | 19.2% (-2.0pp) | 17.9% (-0.8pp) |
Thinking about buying in NYC? Chat with our complimentary, licensed Concierge to learn about the buying process.
StreetEasy is an assumed name of Zillow, Inc. which has a real estate brokerage license in all 50 states and D.C. See real estate licenses. StreetEasy does not intend to interfere with any agency agreement you may have with a real estate professional or solicit your business if you are already under contract to purchase or sell property. All data for uncited sources in this presentation has been sourced from Zillow data. Copyright © 2026 by Zillow, Inc. and/or its affiliates. All rights reserved.