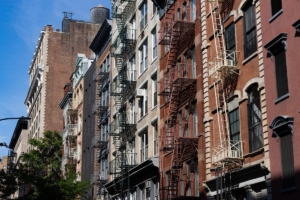
StreetEasy’s Manhattan rent score shows the relative price level of every rental building in the borough, controlling for various factors. How does yours compare? (Getty Images)
Rents in Manhattan are among the highest of any metropolitan region in the world. And yet we often hear about a friend or a coworker who scored a great deal in the West Village or SoHo, suggesting that there are many hidden deals in otherwise expensive areas. So how can you find the cheapest rental in your desired neighborhood?
In a new analysis, StreetEasy ranked every rental building in Manhattan from least to most expensive, using a score of 0 to 10. This metric holds qualities such as bedroom count and unit floor constant across buildings, and includes any building with at least five rentals between 2014 and 2018.
This StreetEasy Rent Score shows the relative expensiveness of different buildings — and thus how much prices can vary widely within a neighborhood, even along a certain street.
Use the tool below to find the buildings with a lower Rent Score in your favorite neighborhoods. You can also look up your building’s Rent Score and see how it compares to every other rental building in Manhattan.
Finding Budget-Friendly Buildings in Pricey Neighborhoods
There’s a wide variance in New York housing stock. So a large number of high-Rent Score buildings in one neighborhood does not mean there won’t be buildings with lower Rent Scores there, too.
Say you love Mulberry Street in Little Italy, but want to live on a tight budget. With this tool, you can find the lowest-priced buildings on the street.
For instance, the building at 132-138 Mulberry St. has a high score of 9.2 — but just across the street, 139 Mulberry St. has a score of 3.4. Obviously, if you’re looking to live in this neighborhood for a relative bargain, 139 Mulberry is a great place to look.
Here are other lower-cost buildings on typically expensive streets — hidden gems for the budget-conscious renter:
| Address | Neighborhood | Rent Score | Median Rent |
|---|---|---|---|
| 349 West Broadway | SoHo | 5.4 | $2,450 |
| 376 Broadway | Tribeca | 4.9 | $3,200 |
| 47 E. 30th St. | Flatiron | 5.4 | $2,100 |
| 103 Macdougal St. | West Village | 3.3 | $2,495 |
| 176 Seventh Ave. | Chelsea | 4.4 | $2,250 |
The Factors That Contribute to High (and Low) Rent Scores
What makes one building have a higher or lower Rent Score than another? It depends on a number of factors, including a building’s age and amenities, and a neighborhood’s schools and accessibility to transit. Judging by this analysis, the most expensive buildings in New York City also tend to offer unusually large spaces or other hard-to-find features.
Let’s look again at Mulberry Street. According to the description, the building at 132-138 Mulberry consists “largely of live/work converted factory lofts with rustic original details blended with high end finishes … ranging from 1,250 square feet to 2,300 square feet.” A look at this 1-bedroom loft, the smallest unit in the building, quickly shows why the apartment carries a $6,250 price tag.
Meanwhile, a 1-bedroom apartment available recently in 139 Mulberry St. was asking $2,200 – not cheap, but still far below the $2,850 median asking rent for 1-bedroom apartments in Little Italy in the third quarter of 2019. Pictures of the apartment suggest why the price is lower — it has an “open layout” with no doors, much like an alcove studio, and appears to lack high-end finishes or amenities.
Buildings with lower Rent Scores are typically valued below the median rents for the neighborhood — but usually for good reason, such as their particular unit amenities or layouts.
Newer, Taller Buildings Have the Highest Rent Scores
There is a lot of variation in price at the walk-up level, but all of Manhattan’s tallest residential buildings have higher scores. Fifty percent of buildings with between one to seven floors have a Rent Score from below 2 to 9 — but 75 percent of buildings with more than seven floors have scores above 5. At the supertall level, of buildings with more than 50 floors, Rent Scores range from 7 to 9.5.
Newer buildings also have less price variation and are more expensive, on average, than older buildings. Prewar buildings score from 1 to 9, whereas 75 percent of buildings in 1975 or later have a Rent Score above 5. One reason for this difference is that newer buildings often have amenities such as elevators, gyms and pools that add to the rent.
How We Did It
Using rental data on StreetEasy from 2014 to 2018, we estimated the extent to which each building contributed to the rental price of its apartments, while holding constant the qualities of the apartments themselves (e.g. bedroom count, floor, penthouse units). For this, we used year fixed effects, a methodology that captures changes in macroeconomic trends over time, such as mortgage rates, interest rates, tax policies, and inflation. We added building fixed effects, which captures building-specific rent heterogeneity. We then ranked every rental building in Manhattan based on the coefficient of their building fixed-effects, or the expense that each building adds to its apartments’ rent. We converted the coefficients to a relative scale of 0 to 10 based on where each building’s score fell on the percentile of all rentals in Manhattan. We then aggregated the median scores by street to calculate the most expensive streets.
—
Inspired to find your next place in New York? Whether you’re looking to rent or to buy, search NYC apartments on StreetEasy.

