
February 2026 housing market report
Key takeaways:
NYC rental market
- As demand continued to outpace supply, the citywide median asking rent rose 8.2% year-over-year to $3,950.
- Inventory declined annually for the 24th consecutive month in Manhattan, the longest streak ever recorded, as the borough sat out the city’s rental construction boom.
- While competition cooled from last year, renters still faced fierce competition, with the average listing in NYC receiving 52.1% more inquiries than in February 2019.
- Renters looking for two or more bedrooms faced the most challenging market, with competition up more than twofold and inventory down 38.8% from pre-pandemic levels.
- Brooklyn saw the most new rentals with at least two bedrooms last year, with 42.3% of new construction units offering two or three bedrooms, compared to 27.2% in Manhattan.
NYC sales market
- Amid winter storms in February, 1,651 homes entered contract in NYC, down 4.2% from a year ago.
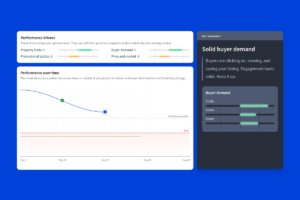
- Manhattan saw 835 homes entering contract, up 0.6% from a year ago, driven by resilient high-end buyer demand.
- As mortgage rates remain close to 6%, a three-year low, improvements in affordability will help the market warm up this spring.

New York City rental inventory fell 5.5% from a year ago to 25,989 units in February. As demand continued to outstrip rental supply, the citywide median asking rent increased 8.2% year-over-year to $3,950.
Manhattan led the decline in the city’s inventory with a 3.5% drop in February — marking the 24th consecutive month of year-over-year declines and the longest streak of consecutive declines ever recorded. Rental supply in the borough has not kept up with surging demand since the onset of return-to-office policies in 2022, leading to declining vacancy rates and accelerating rent growth.
In February, Manhattan’s median asking rent rose 6.9% year-over-year to $4,700, a record high since last summer. In Brooklyn and Queens, as competition spread, the median asking rent rose 7.2% to $3,750 and 5.0% to $3,150, respectively. With low vacancy rates and resilient renter demand, NYC is poised to see faster rent growth in 2026.
NYC Rentals Under $3,500 on StreetEasy Article continues below

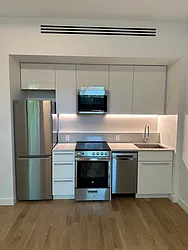
Manhattan sat out NYC’s new development rental boom
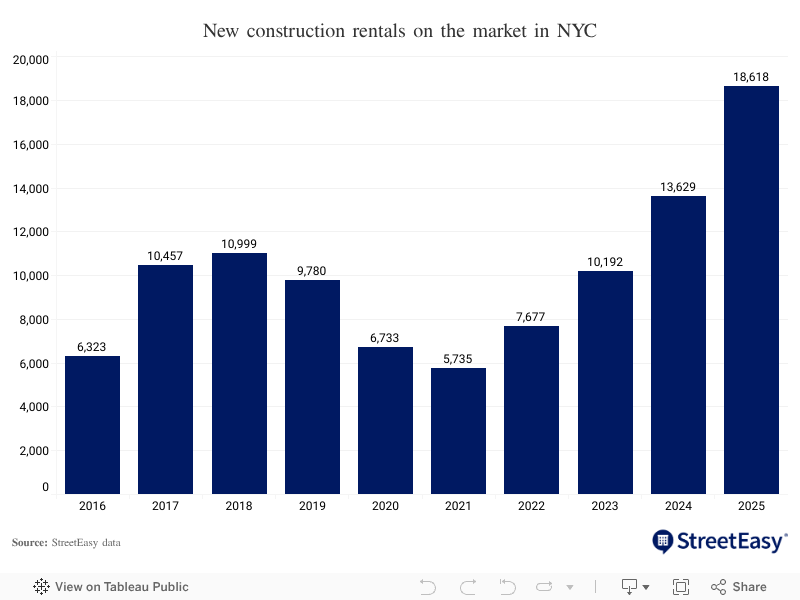
As housing production ramped up in NYC over the past five years, new developments have been rapidly expanding the rental supply. In 2025, 18,618 new construction rental units joined the market, a 36.6% increase from 2024. We define new construction rentals as units in buildings completed in the current or prior year, considering a lag between completion and phased leasing. In 2025, 360 buildings across the city completed that year or the year prior entered the market.
However, Manhattan was slow to catch up. Among the 18,618 new construction rentals across the city in 2025, just 2,575 units were in Manhattan. While several large-scale office-to-residential conversions have begun leasing in the Financial District in recent years, the borough’s new rental supply has been low compared to other boroughs. By comparison, Brooklyn saw 11,167 new units, more than four times that of Manhattan. In Queens, 3,644 units were added.
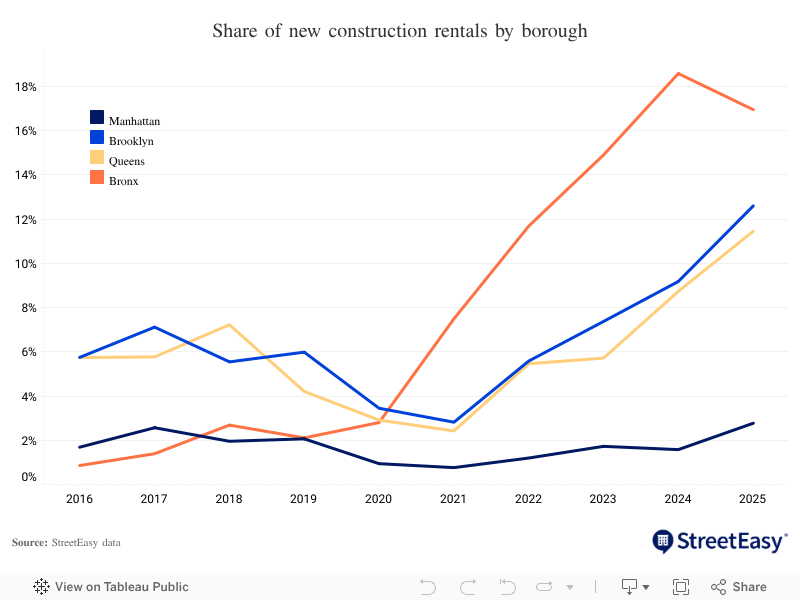
As a result, new construction rentals make up a tiny fraction of the overall Manhattan market. Compared to all new rental listings that hit the borough’s market, just 2.8% were in new developments in 2025. By contrast, one in five new rentals in the Bronx was new construction, the highest in NYC. In Brooklyn and Queens, 12.6% and 11.5% of rentals were new construction.
With limited new construction units to meet demand, renters have been staying put or competing for existing units in prewar properties, which are already located in desirable areas. In Manhattan, rent growth for prewar units has been soaring, narrowing the price gap between new developments that often command higher prices due to their modern finishes and popular amenities. In February, the median asking rent for prewar buildings in Manhattan increased by 10.4% year-over-year to $3,975. Meanwhile, the median asking rent for newer rentals built since 2010 in Manhattan remained unchanged at $5,600.
A large gap in housing supply remains
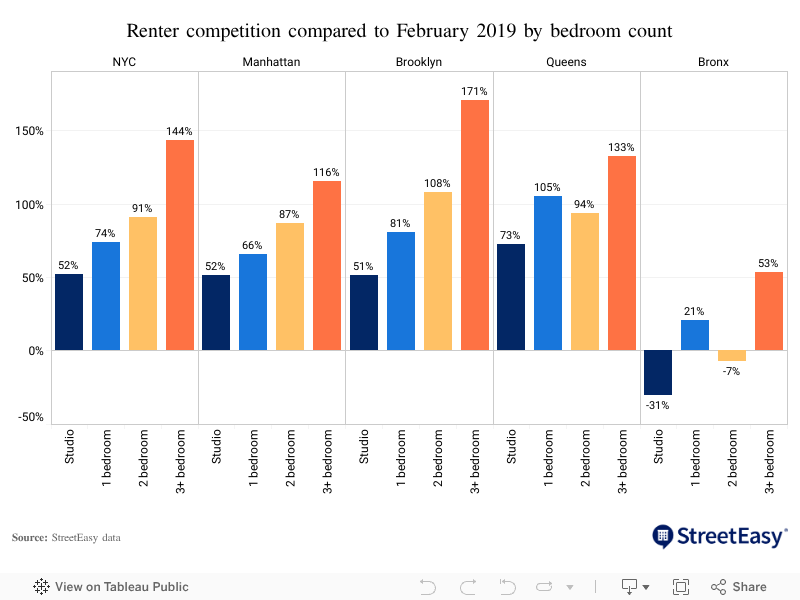
While new construction has surged, renter competition has been moderating since 2022 when the onset of return-to-office policies led to a peak in renter demand. While competition has cooled since then, this hasn’t amounted to significant relief for renters, with the average listing in NYC still receiving 52.1% more inquiries than in February 2019.
Renters looking for apartments with more than one bedroom faced even fiercer competition. Rentals with two bedrooms received 90.7% more inquiries on average than in February 2019, while units with three or more bedrooms received 143.6% more inquiries.
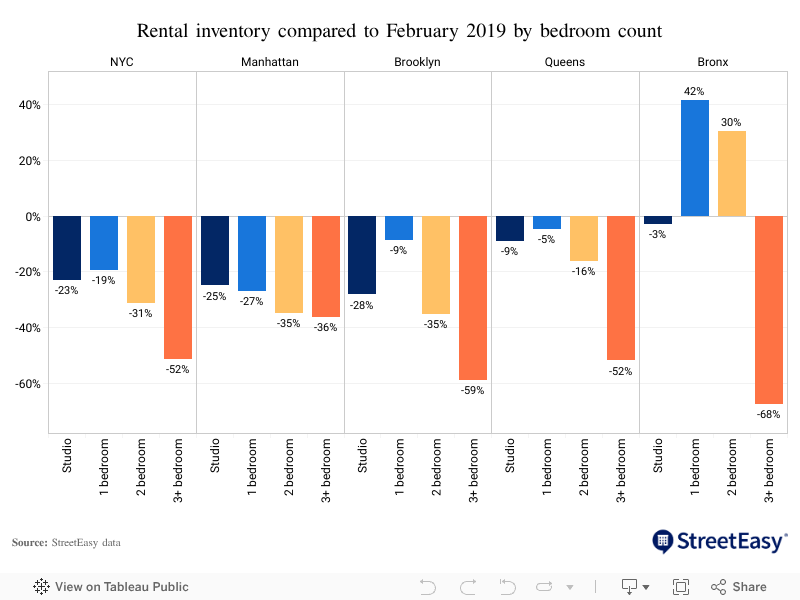
Compared to pre-pandemic levels, the city experienced the most significant shortfalls in rentals with two or more bedrooms. Two-bedroom rental inventory was 31.2% lower than in February 2019, while the inventory of rentals with at least three bedrooms was down 51.5%. Though more plentiful, studio and one-bedroom rental inventory was also down 19.4% and 23.1%, respectively, from February 2019.
The scarcity of apartments with more bedrooms can be challenging for families or renters looking to share costs. Amid strong competition, the citywide median asking rent for two-bedroom units rose 10.9% year-over-year to $4,430 in February 2026, while the median for apartments with at least three bedrooms increased 11.0% to $4,995.
While developers have been ramping up the rental supply, the majority of new units were studios and one-bedroom apartments. In 2025, 61.4% of all new construction units in NYC were studios or one-bedrooms, up from 58.7% in the previous year, and 38.3% were two- or three-bedroom units, down from 41.1%.
In Manhattan, new construction units were heavily skewed toward rentals with fewer bedrooms, with 72.1% being studios or one-bedroom units — likely as developers responded to high demand from renters prioritizing quick commutes over additional bedrooms. Meanwhile, 27.2% of new construction units in the borough had two or three bedrooms. Renters were least likely to find new construction units with two or more bedrooms in the Financial District, our top Neighborhood to Watch in 2026, where close to 80% of new rentals were studios or one-bedrooms.
In Brooklyn, 42.3% of new construction rentals in 2025 had two or three bedrooms, higher than 27.2% in Manhattan and 32.1% in Queens. Boerum Hill, DUMBO, Fort Greene, and Greenpoint took the top spots among neighborhoods with the highest shares of two- and three-bedroom rentals, followed by Mott Haven in the Bronx.
Neighborhoods with highest shares of 2-3BR new construction rentals
| Neighborhood | Borough | New construction rental units | Share of studios and 1BR units | Share of 2BR and 3BR units |
|---|---|---|---|---|
| Boerum Hill | Brooklyn | 524 | 32% | 68% |
| DUMBO | Brooklyn | 1,200 | 47% | 54% |
| Fort Greene | Brooklyn | 959 | 48% | 52% |
| Greenpoint | Brooklyn | 600 | 54% | 46% |
| Mott Haven | Bronx | 1,003 | 56% | 44% |
| Flatbush | Brooklyn | 589 | 57% | 43% |
| Williamsburg | Brooklyn | 1,403 | 58% | 42% |
| Gowanus | Brooklyn | 1,282 | 61% | 39% |
| Crown Heights | Brooklyn | 934 | 62% | 38% |
| Astoria | Queens | 943 | 64% | 36% |
| Long Island City | Queens | 1,707 | 68% | 32% |
| Downtown Brooklyn | Brooklyn | 885 | 71% | 29% |
| Jamaica | Queens | 493 | 72% | 28% |
| Bedford-Stuyvesant | Brooklyn | 575 | 75% | 25% |
| Financial District | Manhattan | 674 | 79% | 21% |
NYC sales market
The NYC sales market slowed in February amid colder-than-usual weather in NYC. Across the city, 1,651 homes entered contract in February, down 4.2% from a year ago. Homes that entered contract spent a median of 94 days on the market, the same as February of last year. Sellers took a pause with 2,760 homes entering the market, down 10.1% from a year ago.
While Brooklyn and Queens saw 7.6% and 11.7% declines in new contracts, Manhattan saw 835 homes entering contract, up 0.6% from a year ago. The continued strong sales activity in Manhattan is likely driven by resilient demand from buyers with higher budgets.
NYC Homes Under $1M on StreetEasy Article continues below


While economic uncertainty persists, the gradual improvement in affordability will likely continue to support sales activity in NYC. The 30-year mortgage rate remained close to 6% in February, a three-year low. The median asking price in NYC dipped to $999,000 in February, 3.8% below a year ago, as new sellers adjusted prices according to market conditions.
As long as mortgage rates remain stable, new contracts and new listings could ramp up as delayed sales and listing activity takes place over the coming months. With citywide inventory up 4.3% in February from a year ago, buyers can expect additional options this spring. For sellers, maximizing exposure will be essential as new listings abound.
NYC market data: February 2026
Sales
 NYC |
 Manhattan |
 Brooklyn |
 Queens | |
|---|---|---|---|---|
| Median asking price | $999,000 (-3.8% YoY) | $1,450,000 (0.0%) | $995,000 (-7.4%) | $674,700 (+3.8%) |
| Number of homes for sale | 13,981 (+4.3%) | 7,072 (-0.8%) | 3,471 (+7.1%) | 2,649 (+13.7%) |
| Homes entering contract | 1,651 (-4.2%) | 835 (+0.6%) | 436 (-7.6%) | 303 (-11.7%) |
| Median days on market | 94 (0) | 105 (-5) | 84 (+5) | 86 (+17) |
Rentals
|
NYC |
Manhattan |
Brooklyn |
Queens | |
|---|---|---|---|---|
| Median asking rent | $3,950 (+8.2% YoY) | $4,700 (+6.9%) | $3,750 (+7.2%) | $3,150 (+5.0%) |
| Number of homes for rent | 25,989 (-5.5%) | 11,670 (-3.3%) | 9,332 (-5.9%) | 3,996 (-9.7%) |
| Share of rentals with price cuts | 11.8% (-1.3pp) | 14.3% (-0.4pp) | 9.8% (-2.3pp) | 11.0% (-0.4pp) |
| Share of rentals offering concessions* | 21.6% (+5.0pp) | 17.5% (+2.2pp) | 24.2% (+7.8pp) | 22.5% (+3.7pp) |
Looking to buy a home in NYC? Get in touch with our complimentary, licensed StreetEasy Concierge to learn about today’s buying market in NYC and more.
StreetEasy is an assumed name of Zillow, Inc. which has a real estate brokerage license in all 50 states and D.C. See real estate licenses. StreetEasy does not intend to interfere with any agency agreement you may have with a real estate professional or solicit your business if you are already under contract to purchase or sell property. All data for uncited sources in this presentation has been sourced from Zillow data. Copyright © 2026 by Zillow, Inc. and/or its affiliates. All rights reserved.