StreetEasy’s Q1 2020 Market Reports show how COVID-19 disrupted the spring home-shopping season. (Getty Images)
Key findings:
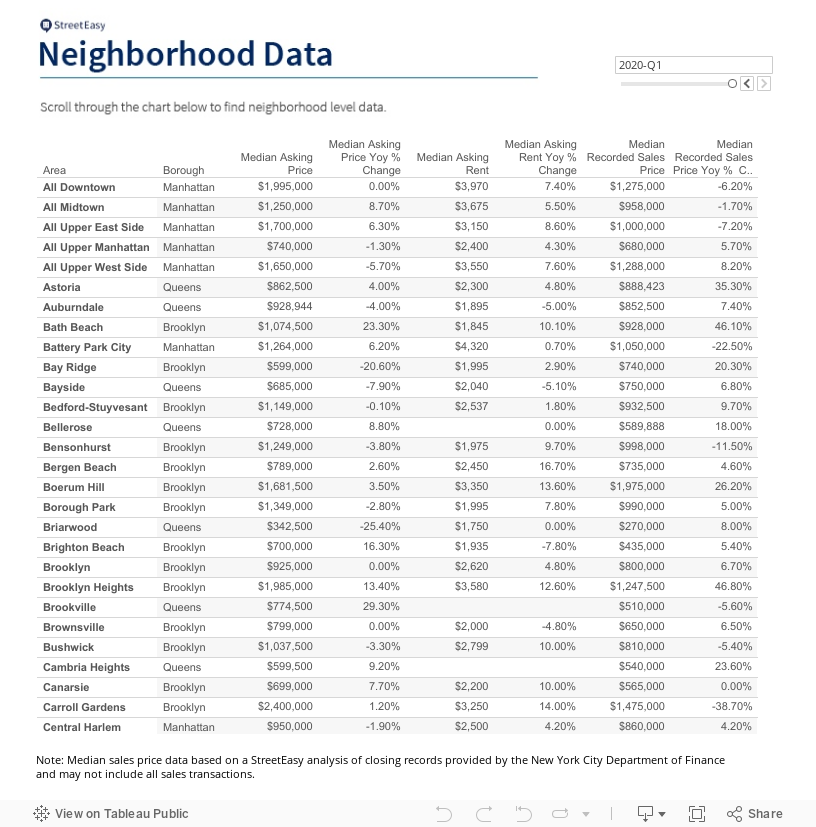
- Prior to COVID-19, Manhattan sales prices had fallen to a six-year low, and rents had reached new highs in all boroughs analyzed, according to StreetEasy’s Q1 2020 Market Reports.
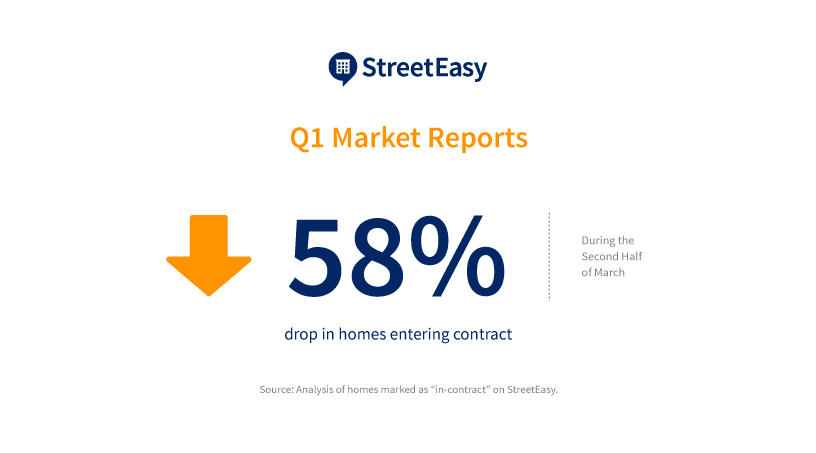
- Coronavirus precautions prompted buyer activity to slow dramatically, with 58% fewer pending sales in the last two weeks of March compared to the first two weeks.
- New sales inventory fell 73% in the second half of March compared to the first half of the month. New rental listings fell 52% in the same period.
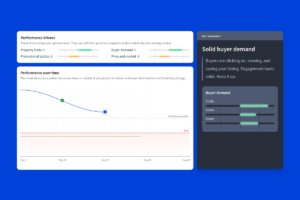
- The number of walkthrough videos on StreetEasy more than quadrupled in March from February as the real estate market adjusted to social distancing restrictions.
Before the coronavirus pandemic hit New York City, sales prices were falling and rents were heating up rapidly, according to StreetEasy’s Q1 2020 Market Reports [i]. As the end of the quarter approached, the NYC sales market appeared poised for another competitive home-shopping season, with more sellers adding homes to the market, and buyers ready to use their negotiating power amid falling prices.
In the two weeks before the quarter ended, the pandemic’s impact on daily life intensified. As social distancing became the norm, uncertainty shifted the real estate market’s outlook. Citywide, new sales inventory fell significantly, with 73% fewer new sales listings added to StreetEasy between March 15 and March 29 than in the two weeks prior. Buyer activity dropped off, too: 58% fewer homes went into contract [ii] in the last two full weeks of March compared to the first two weeks.
The rentals market felt similar effects. New rental listings fell 52% in the second half of March compared to the first half. While asking rents changed minimally, 20% fewer landlords offered a rent cut on their unit at the end of the month than the beginning. Rather than offer discounts, many landlords have chosen to keep their units off the market until the pandemic slows.
Buyers, sellers, renters, and agents also changed their behaviors to adapt to the stay-at-home order and public health protocols. The addition of walkthrough videos to listings on StreetEasy increased 330% in March over February.
Since March 15, daily walkthrough video views are up eightfold on rental listings and threefold for sales listings. StreetEasy also launched 3D Home® tours to help NYC home shoppers continue their search though an integration with the Zillow 3D Home app.
“Economic uncertainty is causing understandable hesitation from buyers, sellers, and renters,” says StreetEasy Economist Nancy Wu.“ In the best-case scenario, home-shopping season has simply been postponed for a few months. With so many variables — including how COVID-19 may spread, and other policy and economic reactions to the virus — it’s too soon to try and predict what will happen. But if coronavirus does in fact trigger a global recession, we could see prices and buyer activity levels mimic what happened during the 2008 financial crisis.”
“Nevertheless, activity continues for those who need to move for life events, or renters who must sign a new lease. New Yorkers are nimble, and our adaptation to the times and quick adoption of new technology is like nothing this city has seen before.”
Q1 2020 Key Findings — Manhattan
During the first quarter, the StreetEasy Manhattan Price Index [iii] dropped 3.2%, to a six-year low of $1,073,104. Prices have not shifted since the stay-at-home order took effect, but that could change in the coming months. The StreetEasy Manhattan Rent Index [iv] also reached a record high of $3,324 – up 3.4% annually.
Q1 2020 Key Findings — Brooklyn
Before the coronavirus pandemic, rents in Brooklyn were growing at the fastest rate in the city — 5.2% year over year, reaching a record high of $2,755. To adjust for the high rents, more concessions were also offered by landlords. The share of units that advertised a concession in Brooklyn rose 4.8 percentage points to 14.5% in Brooklyn. The StreetEasy Brooklyn Price Index remained unchanged from last year at $704,783.
Q1 2020 Key Findings — Queens
Prices in Queens remained flat for the third quarter in a row, at $512,533. Prior to 2020, prices in the borough had been increasing rapidly for seven years since their upturn after the Great Recession. Homes in Queens spent a median of 85 days on the sales market — an uptick of 9 days compared to last year, and the longest period in seven years. Sales in the borough could slow even more due to the coronavirus pandemic. Rents in Queens rose 3.5% annually to $2,215 – a new high for the borough.
Definitions of StreetEasy’s metrics and monthly data from each report can be explored and downloaded via the StreetEasy Data Dashboard.
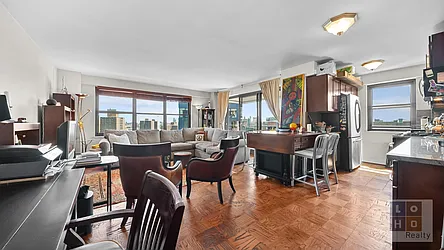
Manhattan and Brooklyn 1-2BRs Under $1M With Virtual Tours on StreetEasy Article continues below


[i] The StreetEasy Market Reports are a monthly overview of the Manhattan, Brooklyn and Queens sales and rental markets. Every three months, a quarterly analysis is published. The report data is aggregated from public recorded sales and listings data from real estate brokerages that provide comprehensive coverage of Manhattan, Brooklyn and Queens, with more than a decade of history for most metrics. StreetEasy tracks data for all five boroughs within New York City, but currently only produces reports for Manhattan, Brooklyn and Queens.
[ii] StreetEasy defines pending sales as homes that are marked as “in-contract” on StreetEasy. An offer on these has been made and accepted, and the closing is pending.
[iii] The StreetEasy Price Indices track changes in resale prices of condo, co-op, and townhouse units. Each index uses a repeat-sales method of comparing the sales prices of the same properties since January 1995 in Manhattan and January 2007 in Brooklyn and Queens. Given this methodology, each index accurately captures the change in home prices by controlling for the varying composition of homes sold in a given month. Levels of the StreetEasy Price Indices reflect average values of homes on the market. Data on the sale of homes is sourced from the New York City Department of Finance. Full methodology here.
[iv] The StreetEasy Rent Indices are monthly indices that track changes in rent for all housing types and are currently available from January 2007 in Manhattan, January 2010 in Brooklyn, and January 2012 in Queens. Each index uses a repeat-sales method similar that used to calculate the StreetEasy Price Indices. The repeat method evaluates rental price growth based on homes in a given geography that have listed for rent more than once. More details on methodology here.
—
Whether you’re looking to rent or to buy, find your next NYC home on StreetEasy.