
The Q3 2018 StreetEasy Market Reports show a historic drop in Manhattan home prices.
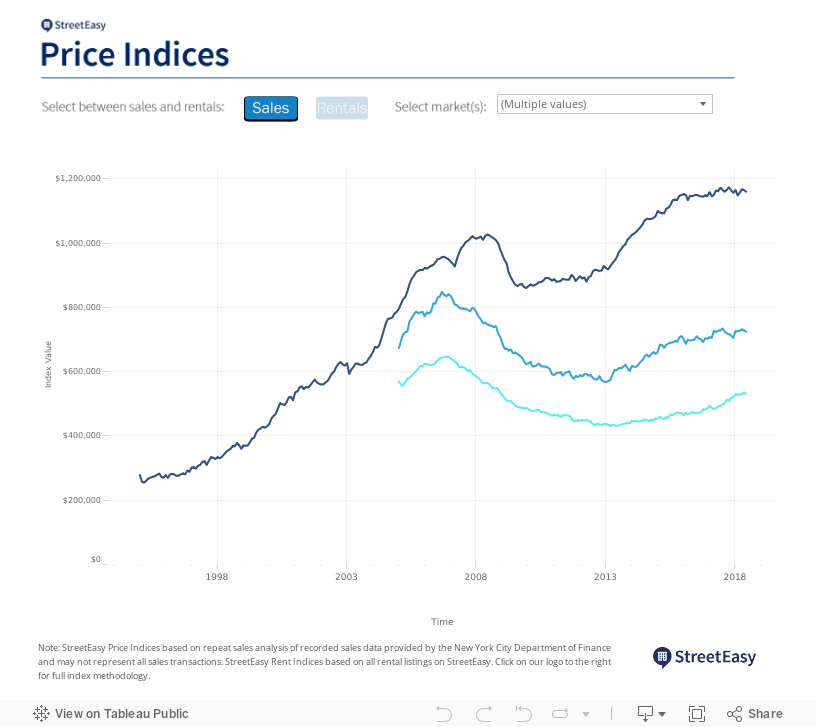
As summer came to a close, dynamics in the NYC real estate market continued to pivot in favor of buyers, particularly in Manhattan. The StreetEasy Manhattan Price Index [i] dropped to $1,142,742 in the third quarter of 2018, a decrease of 1.8 percent, or $20,597, since last year — marking the largest annual dip in prices since the financial crisis [ii], according to the Q3 2018 StreetEasy Market Reports [iii].
In addition to the decline in prices, for-sale inventory in Manhattan remained close to post-crisis highs, with nearly 5,000 new homes listed in the third quarter — a 7.8 percent increase from last year. Manhattan homes lingered on the market for a median of 96 days, the longest period since 2012 and eight days longer than in the third quarter of 2017.
Despite the increase in homes on the market, the number of homes sold decreased. Recorded sales [iv] in Manhattan dropped 16.9 percent year-over-year, with Brooklyn and Queens not far behind, falling 15.7 percent and 12.1 percent, respectively. This quarter also marked the lowest number of third-quarter sales since recovery from the financial crisis began in 2012.
“There’s a palpable shift in the market happening right now that’s mostly in favor of buyers, and we’re not done yet. Winter is typically the slowest home shopping season, and we’re already seeing a lot of homes lingering on the market,” says StreetEasy Senior Economist Grant Long. “Sellers that have priced their homes aggressively will likely have to offer some substantial price cuts, or risk spending several more months trying to find the right buyer. If they don’t strike a deal soon, they’ll be forced to compete with yet another wave of new homes hitting the market in the spring, making their chances of attracting a buyer even tougher.”
See below for additional rental and sales market trends across Manhattan, Brooklyn and Queens.
Q3 2018 Key Findings — Manhattan
- Sales prices dropped. The StreetEasy Manhattan Price Index dipped 1.8 percent year-over-year to $1,142,742.
- Nearly 5,000 new homes came onto the market. New sales inventory increased 7.8 percent, with an additional 4,921 new units listed since last year.
- More than 1 in 5 homes had their prices cut. The share of homes with a price cut rose 12.6 percentage points year-over-year, following an influx of new inventory. Buyers were most likely to find price cuts in the Upper West Side [v], where 24.3 percent of homes received one — up 25.6 percentage points since last year.
- Rents rose in Manhattan, and rose the most in the Upper East Side. The StreetEasy Manhattan Rent Index [vi] reached an all-time high of $3,247, a 2.2 percent increase over the third quarter in 2017. Rents rose the most in the Upper East Side [vii], up 2.7 percent to an all-time high of $2,985.
- The share of rentals with a price cut dropped. The share of rentals that had their prices cut fell to 21.9 percent in the third quarter, a decrease of 6.4 percentage points from last year.
Q3 2018 Key Findings — Brooklyn
- Home prices stagnated since last year. The StreetEasy Brooklyn Price Index remained unchanged at $721,918. North Brooklyn [viii] and Prospect Park [ix] saw the largest increases in the borough, up 3.8 and 3.6 percent, to $1,190,797 and $1,041,163, respectively.
- Inventory rose across the borough, except in North Brooklyn. Sales inventory increased 16.4 percent annually. North Brooklyn was the only submarket where inventory dipped, down 1.7 percent compared to last year.
- Recorded sales fell. The number of recorded sales dropped 15.7 percent in Brooklyn. In North Brooklyn, sales were down 44 percent since last year.
- Rents rose across the borough, except in North Brooklyn. The StreetEasy Brooklyn Rent Index rose 1.5 percent from last year to $2,604. In North Brooklyn, rents dipped 1.9 percent to $3,041 ahead of the April 2019 L train shutdown.
- The share of rent cuts dropped. The share of rentals with a price cut dipped 5.7 percentage points to 17.7 percent in the borough. The share of rent cuts decreased the most in North Brooklyn, at 7.7 percentage points, but renters were still most likely to find price cuts there with 23 percent of rental units discounted.
Q3 2018 Key Findings — Queens
- Sale prices increased. The StreetEasy Queens Price Index rose 4.9 percent to $534,754. The Rockaways [x] experienced the largest annual increase, with prices up 13.5 percent to reach $500,939.
- Homes with a price cut rose the most in Queens. The share of for-sale homes offering price cuts rose 3.9 percentage points, reaching 18.2 percent.
- The number of recorded sales fell. The number of recorded sales was down 12.1 percent in Queens. Northwest Queens [xi] saw the largest decrease — down 27.7 percent from the third quarter of 2017.
- Rents stagnated. Queens rents remained mostly unchanged, rising 0.7 percent in the third quarter to $2,163.
- The share of rent cuts dropped. Just 4 percent of rentals in Queens had their prices cut in the third quarter, a decrease of 3.8 percentage points from this time last year. Renters were most likely to find discounts in Northeast Queens [xii], where 18.6 percent of units had their rent prices cut.
The complete StreetEasy Market Reports for Manhattan, Brooklyn and Queens, with additional neighborhood data and graphics, can be viewed here. Definitions of StreetEasy’s metrics and monthly data from each report are available here.
—
[i] The StreetEasy Price Indices track changes in resale prices of condo, co-op, and townhouse units. Each index uses a repeat-sales method of comparing the sales prices of the same properties since January 1995 in Manhattan and January 2007 in Brooklyn and Queens. Given this methodology, each index accurately captures the change in home prices by controlling for the varying composition of homes sold in a given month. Levels of the StreetEasy Price Indices reflect average values of homes on the market. Data on the sale of homes is sourced from the New York City Department of Finance. Full methodology here.
[ii] The drop in the StreetEasy Manhattan Price Index in the third quarter of 2018 was the largest annual drop since May 2010.
[iii] The StreetEasy Market Reports are a monthly overview of the Manhattan, Brooklyn and Queens sales and rental markets. Every three months, a quarterly analysis is published. The report data is aggregated from public recorded sales and listings data from real estate brokerages that provide comprehensive coverage of Manhattan, Brooklyn and Queens, with more than a decade of history for most metrics. The reports are compiled by the StreetEasy Research team. For more information, visit https://streeteasy.com/blog/research/market-reports/. StreetEasy tracks data for all five boroughs within New York City, but currently only produces reports for Manhattan, Brooklyn and Queens.
[iv] Recorded sales are projected for the period based upon 1) data received from the New York City Department of FInance through the final day of the period and 2) historical seasonal trends.
[v] The Upper West Side submarket includes Lincoln Square, Upper West Side, Manhattan Valley and Morningside Heights.
[vi] The StreetEasy Rent Indices are monthly indices that track changes in rent for all housing types and are currently available from January 2007 in Manhattan, January 2010 in Brooklyn and January 2012 in Queens. Each index uses a repeat-sales method similar that used to calculate the StreetEasy Price Indices. The repeat method evaluates rental price growth based on homes in a given geography that have listed for rent more than once. More details on methodology here.
[vii] The Upper East Side submarket includes Upper East Side, Lenox Hill, Yorkville, Carnegie Hill and Upper Carnegie Hill.
[viii] The North Brooklyn submarket includes Greenpoint, Williamsburg and East Williamsburg.
[ix] The Prospect Park submarket includes Park Slope, Windsor Terrace, Prospect Heights, Prospect Lefferts Gardens and Prospect Park South.
[x] The Rockaways submarket includes Far Rockaway, Broad Channel, Arverne, Rockaway Park, Bayswater, Belle Harbor, Breezy Point, Neponsit, Edgemere and Hammels.
[xi] The Northwest Queens submarket includes Astoria, Long Island City, Sunnyside and Ditmars-Steinway.
[xii] The Northeast Queens submarket includes Flushing, Whitestone, College Point, Fresh Meadows, Kew Gardens Hills, Kew Gardens, Bayside, Douglaston, Little Neck, Auburndale, Glen Oaks, Floral Park, Bellerose, Briarwood, New Hyde Park, Oakland Gardens, Hillcrest, Pomonok, Utopia, Bowne Park, Clearview, Alley Park and Queensboro Hill.
—
Hey, why not like StreetEasy on Facebook and follow @streeteasy on Instagram?